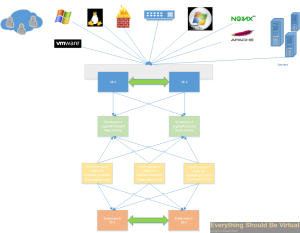
In this post I will be going over how to setup a complete ELK
(Elasticsearch, Logstash and Kibana) stack with clustered elasticsearch
and all ELK components load balanced using HAProxy. I will be setting up
a total of four six servers (2-HAProxy, 2-ELK frontends and
2-Elasticsearch master/data nodes) in this setup however you can scale
the ELK stack by adding additional nodes identical to
logstash-1/logstash-2 for logstash processing and Kibana web interfaces
and adding the additional node info to the HAProxy configuration files
to load balance. You can also scale the Elasticsearch Master/Data nodes
by building out addtional nodes and they will join the cluster.
Acronyms throughout article
ELK - Elasticsearch Logstash Kibana
ES - Elasticsearch
Requirements:
In order for all logstash-elasticsearch clustering to work correctly all
HAProxy nodes and ELK nodes should be on the same subnet (If not you
will need to configure unicast mode for Elasticsearch as multicast is
enabled using these scripts).
Two Ubuntu (12.04LTS/14.04LTS) HAProxy nodes with two NICS each.
(1vCPU and 512MB memory will work)
Two or more Ubuntu (12.04LTS/14.04LTS) nodes to install the ELK stack
frontends. (2vCPU and 2GB memory will work)
Two or more Ubuntu (12.04LTS/14.04LTS) nodes to install the ES
Master/Data nodes. (2vCPU and 4GB of memory will work)
IP Addresses required to set all of this up. (Change to fit your
environment.)
DNS A Record: logstash (with the LB VIP address) (If you use
something other than this name update in each location that logstash is
configured for. I will be providing a script to do this in the near
future.)
LB VIP 10.0.101.60
haproxy-1 10.0.101.61
haproxy-2 10.0.101.62
logstash-1 10.0.101.185
logstash-1 172.16.0.1 (Cluster Heartbeat)
logstash-2 10.0.101.180
logstash-2 172.16.0.2 (Cluster Heartbeat)
es-1 10.0.101.131
es-2 10.0.101.179
If you decide to use different node names than the above list then you
will need to make sure to make changes to the configurations to reflect
these changes.
HAProxy Nodes (haproxy-1, haproxy-2):
Setup both HAProxy nodes identical all the way down to the ELK stack
setup section. The below instructions which have been crossed out are no
longer valid but will remain in the off chance that you would like to
use heartbeat instead of keepalived for your cluster setup.
First thing we need to do is install all of the packages needed.
sudo apt-get install haproxy heartbeat watchdog
Now we will need to configure networking on each nodes as follows.
(Again modify to fit your environment.)
sudo apt-get install haproxy keepalived
HAProxy-1 (Primary)
sudo nano /etc/network/interfaces
Overwrite the contents with the code from below.
iface lo inet loopback
auto lo
auto eth0
iface eth0 inet static
address 10.0.101.61
netmask 255.255.255.0
gateway 10.0.101.1
dns-search everythingshouldbevirtual.local
dns-nameservers 10.0.101.110 10.0.101.111 10.0.101.112
auto eth1
iface eth1 inet static
address 172.16.0.1
netmask 255.255.255.0
HAProxy-2 (Failover)
sudo nano /etc/network/interfaces
Overwrite the contents with the code from below.
iface lo inet loopback
auto lo
auto eth0
iface eth0 inet static
address 10.0.101.62
netmask 255.255.255.0
gateway 10.0.101.1
dns-search everythingshouldbevirtual.local
dns-nameservers 10.0.101.110 10.0.101.111 10.0.101.112
auto eth1
iface eth1 inet static
address 172.16.0.2
netmask 255.255.255.0
We need to allow an interface to be brought online that is not part of
the /etc/network/interfaces configuration so we need to run the
following. This will allow all of our VIP’s to come up.
echo "net.ipv4.ip_nonlocal_bind=1" >> /etc/sysctl.conf
Verify that the above setting has been set by running the following on
each node. You should get back the
following net.ipv4.ip_nonlocal_bind = 1
Now you will need to restart networking on each node or reboot for the
IP settings from above to be set.
sudo service networking restart
Now we are ready to configure our heartbeat service on each node. We
will do that by setting up the following configuration files on each
node.
sudo nano /etc/ha.d/ha.cf
Copy the following into ha.cf file.
watchdog /dev/watchdog
logfile /var/log/ha-log
debugfile /var/log/ha-debug
deadtime 5
warntime 10
initdead 15
bcast eth1
auto_failback on
node haproxy-1
node haproxy-2
keepalive 2
ping 172.16.0.1
udpport 694
sudo nano /etc/ha.d/authkeys
Copy the following into authkeys (change password to something else).
auth 3
1 crc
2 sha1 password
3 md5 password
Now change the permissions of the authkeys as follows.
sudo chmod 600 /etc/ha.d/authkeys
Now we will create the haresources file to complete the heartbeat
service setup.
sudo nano /etc/ha.d/haresources
Copy the following into haresources.
haproxy-1 IPaddr::10.0.101.60/24/eth0 logstash
Now we need to configure the keepalived cluster service. All that we
need to do is create /etc/keepalived/keepalived.conf
sudo nano /etc/keepalived/keepalived.conf
And copy the contents from below and save the file. Make sure to modify
the IP addresses to match your environment.
vrrp_script chk_haproxy {
script "killall -0 haproxy" # verify the pid existance
interval 2 # check every 2 seconds
weight 2 # add 2 points of prio if OK
}
vrrp_instance VI_1 {
interface eth0 # interface to monitor
state MASTER
virtual_router_id 51 # Assign one ID for this route
priority 101 # 101 on master, 100 on backup (Make sure to change this on HAPROXY node2)
virtual_ipaddress {
10.0.101.60 # the virtual IP's
}
track_script {
chk_haproxy
}
}
Now you need to start the keepalived service
sudo service keepalived start
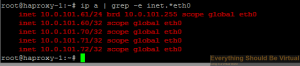
You can check and make sure that all of your VIP’s came up by running
the following. A normal ifconfig will not show them.
sudo ip a | grep -e inet.* eth0
You should see something similar to below.
Now we are ready to setup HAProxy for our ELK stack. The final piece of
our setup for frontend load balancer cluster.
sudo nano /etc/haproxy/haproxy.cfg
Replace all contents in haproxy.cfg with the following code.
global
log logstash local0 #Change logstash to your naming
log-send-hostname
chroot /var/lib/haproxy
user haproxy
group haproxy
daemon
maxconn 4000
defaults
log global
mode http
option httplog
option dontlognull
option redispatch
retries 3
timeout client 35s
timeout server 60s
timeout connect 5s
timeout http-keep-alive 10s
# contimeout 5000
# clitimeout 50000
# srvtimeout 50000
errorfile 400 /etc/haproxy/errors/400.http
errorfile 403 /etc/haproxy/errors/403.http
errorfile 408 /etc/haproxy/errors/408.http
errorfile 500 /etc/haproxy/errors/500.http
errorfile 502 /etc/haproxy/errors/502.http
errorfile 503 /etc/haproxy/errors/503.http
errorfile 504 /etc/haproxy/errors/504.http
listen stats :9090
balance
mode http
stats enable
stats auth admin:admin
listen logstash-syslog-TCP-514 10.0.101.60:514
mode tcp
option tcpka
option tcplog
#balance leastconn - The server with the lowest number of connections receives the connection
#balance roundrobin - Each server is used in turns, according to their weights.
#balance source - Source IP hashed and divided by total weight of servers designates which server will receive the request
balance roundrobin
server logstash-1 logstash-1:514 check
server logstash-2 logstash-2:514 check
listen logstash-VMware-TCP-1514 10.0.101.60:1514
mode tcp
option tcpka
option tcplog
#balance leastconn - The server with the lowest number of connections receives the connection
#balance roundrobin - Each server is used in turns, according to their weights.
#balance source - Source IP hashed and divided by total weight of servers designates which server will receive the request
balance roundrobin
server logstash-1 logstash-1:1514 check
server logstash-2 logstash-2:1514 check
listen logstash-vCenter-TCP-1515 10.0.101.60:1515
mode tcp
option tcpka
option tcplog
#balance leastconn - The server with the lowest number of connections receives the connection
#balance roundrobin - Each server is used in turns, according to their weights.
#balance source - Source IP hashed and divided by total weight of servers designates which server will receive the request
balance roundrobin
server logstash-1 logstash-1:1515 check
server logstash-2 logstash-2:1515 check
listen logstash-Netscaler-TCP-1517 10.0.101.60:1517
mode tcp
option tcpka
option tcplog
#balance leastconn - The server with the lowest number of connections receives the connection
#balance roundrobin - Each server is used in turns, according to their weights.
#balance source - Source IP hashed and divided by total weight of servers designates which server will receive the request
balance roundrobin
server logstash-1 logstash-1:1517 check
server logstash-2 logstash-2:1517 check
listen logstash-eventlog-TCP-3515 10.0.101.60:3515
mode tcp
option tcpka
option tcplog
#balance leastconn - The server with the lowest number of connections receives the connection
#balance roundrobin - Each server is used in turns, according to their weights.
#balance source - Source IP hashed and divided by total weight of servers designates which server will receive the request
balance roundrobin
server logstash-1 logstash-1:3515 check
server logstash-2 logstash-2:3515 check
listen logstash-iis-TCP-3525 10.0.101.60:3525
mode tcp
option tcpka
option tcplog
#balance leastconn - The server with the lowest number of connections receives the connection
#balance roundrobin - Each server is used in turns, according to their weights.
#balance source - Source IP hashed and divided by total weight of servers designates which server will receive the request
balance roundrobin
server logstash-1 logstash-1:3525 check
server logstash-2 logstash-2:3525 check
listen logstash-redis-TCP-6379 10.0.101.60:6379
mode tcp
option tcpka
option tcplog
#balance leastconn - The server with the lowest number of connections receives the connection
#balance roundrobin - Each server is used in turns, according to their weights.
#balance source - Source IP hashed and divided by total weight of servers designates which server will receive the request
balance roundrobin
server logstash-1 logstash-1:6379 check
server logstash-2 logstash-2:6379 check
listen elasticsearch-TCP-9200 10.0.101.60:9200
mode tcp
option tcpka
option tcplog
#balance leastconn - The server with the lowest number of connections receives the connection
#balance roundrobin - Each server is used in turns, according to their weights.
#balance source - Source IP hashed and divided by total weight of servers designates which server will receive the request
balance roundrobin
server logstash-1 logstash-1:9200 check
server logstash-2 logstash-2:9200 check
listen elasticsearch-TCP-9300 10.0.101.60:9300
mode tcp
option tcpka
option tcplog
#balance leastconn - The server with the lowest number of connections receives the connection
#balance roundrobin - Each server is used in turns, according to their weights.
#balance source - Source IP hashed and divided by total weight of servers designates which server will receive the request
balance roundrobin
server es-1 es-1:9300 check
server es-2 es-2:9300 check
listen kibana-http 10.0.101.60:80
mode http
stats enable
stats auth admin:password # Change this to your own username and password!
#balance leastconn - The server with the lowest number of connections receives the connection
#balance roundrobin - Each server is used in turns, according to their weights.
#balance source - Source IP hashed and divided by total weight of servers designates which server will receive the request
balance source
option httpclose
option forwardfor except 10.0.101.61 # Change this to 10.0.101.62 (Or IP of second node) when setting up second node
cookie JSESSIONID prefix indirect nocache
server logstash-1 logstash-1:80 check cookie L1
server logstash-2 logstash-2:80 check cookie L2
listen kibana-https 10.0.101.60:8443
mode http
stats enable
stats auth admin:password # Change this to your own username and password!
#balance leastconn - The server with the lowest number of connections receives the connection
#balance roundrobin - Each server is used in turns, according to their weights.
#balance source - Source IP hashed and divided by total weight of servers designates which server will receive the request
balance source
#option httpchk
option httpclose
option forwardfor except 10.0.101.61 # Change this to 10.0.101.62 (Or IP of second node) when setting up second node
cookie JSESSIONID prefix indirect nocache
server logstash-1 logstash-1:8080 check cookie L1
server logstash-2 logstash-2:8080 check cookie L2
Now we need to set HAProxy to enabled so it will start.
sudo nano /etc/default/haproxy
Change
to
Now we should be able to start HAProxy up.
sudo service haproxy start
If you see errors similar to below these can be ignored.
[ WARNING] 153/132650 ( 4054) : config : 'option httplog' not usable with proxy 'logstash-syslog-514' ( needs 'mode http' ) . Falling back to 'option tcplog' .
[ WARNING] 153/132650 ( 4054) : config : 'option httplog' not usable with proxy 'logstash-syslog-1514' ( needs 'mode http' ) . Falling back to 'option tcplog' .
[ WARNING] 153/132650 ( 4054) : config : 'option httplog' not usable with proxy 'logstash-eventlog' ( needs 'mode http' ) . Falling back to 'option tcplog' .
[ WARNING] 153/132650 ( 4054) : config : 'option httplog' not usable with proxy 'logstash-iis' ( needs 'mode http' ) . Falling back to 'option tcplog' .
[ WARNING] 153/132650 ( 4054) : config : 'option httplog' not usable with proxy 'logstash-redis' ( needs 'mode http' ) . Falling back to 'option tcplog' .
[ WARNING] 153/132650 ( 4054) : config : 'option httplog' not usable with proxy 'elasticsearch' ( needs 'mode http' ) . Falling back to 'option tcplog' .
[ OK ]
Now one last thing to do based on the fact that HAProxy cannot load
balance UDP ports and not all network devices have the option to send
their syslog data to a TCP port. We will install an instance of Logstash
and setup rsyslog forwarding on each HAProxy node. This instance will
only listen for syslog on the standard UDP/514 port, do some filtering
and join the logstash-elasticsearch cluster as a client and output to
this cluster. be configured to monitor the nginx logs and forward them
back to the logstash cluster using redis. We will be configuring rsyslog
to listen on UDP/514 and forward to the logstash cluster over TCP/514. I
have made this extremely easy by running a script. However do not
run this until after you have setup your ELK stack nodes below. If you
do set this up prior to building out your ELK nodes then you will need
to restart the logstash service on each of your haproxy nodes.
If for some reason you need to restart the logstash service you can do
so by running.
sudo service logstash restart
So let’s setup our logstash instance and configure rsyslog forwarding.
To do so run the following commands in a terminal session on each of
your HAProxy nodes.
sudo apt-get install git
cd ~
git clone https://github.com/mrlesmithjr/Logstash_Kibana3
chmod +x ./Logstash_Kibana3/Cluster_Setup/Logstash-HAProxy-Node.sh
sudo ./Logstash_Kibana3/Cluster_Setup/Logstash-HAProxy-Node.sh
If you copied the haresources file exactly from above then Logstash
will only be running on the active cluster node and will start on the
failover node when a failover occurs.
Now HAProxy node1 is complete make sure to do all of the above on your
HAProxy node2 and make sure to change the priority as noted in the
keepalived.conf file. Once you have completed HAProxy node2 continue
onto the next section of setting up your ELK stack. You could also clone
the first node to create the second node but if you do; make sure to
make the proper change in keepalived.conf and haproxy.cfg as above.
ES (Elasticsearch Master/Data Nodes (es-1, es-2):
Now we will be setting up our two nodes to build our Elasticsearch
cluster and again I have a script to do this. These nodes will only be
Master/Data nodes. They will not be doing any logstash processing. They
will purely be used to maintain the cluster and provide redundancy.
These nodes will not be exposed to the HAProxy Load Balancers; Only our
ELK nodes below will be. These nodes will process all of the data that
our frontend ELK nodes send back to be ingested, indexed and etc. For
now we will only be setting up two ES Master/Data nodes; however you can
build out as many as you like and use this same script each time for
each additional node (If you add more than two you will want to adjust
the following parameter in /etc/elasticsearch/elasticsearch.yml to
ensure you do not experience a split-brain ES cluster. You will set the
value to n/2+1 where n=number of nodes. So for example with just two
nodes it would be 1 (or not set); whereas with 3 the value would be 2
(3/2+1=2)). Just make sure that every node-name is unique and has a DNS
record associated with it.
discovery.zen.minimum_master_nodes: 2
So let’s get these nodes up and running.
On your new ES nodes run the following script on each to get them
running.
sudo apt-get install git
cd ~
git clone https://github.com/mrlesmithjr/Logstash_Kibana3
chmod +x ./Logstash_Kibana3/Cluster_Setup/Logstash-ES-Cluster-Master-data-node.sh
sudo ./Logstash_Kibana3/Cluster_Setup/Logstash-ES-Cluster-Master-data-node.sh
Once these are up and running your new ES cluster (logstash-cluster)
should be ready to go. However you will want to modify your Java Heap
Size to 50% of the installed memory. So if you installed per the
requirements you will want to adjust the ES_HEAP_SIZE to 2g because by
default it will be at 1g. And it is commented out by default.
sudo nano /etc/init.d/elasticsearch
change
to
Now proceed onto setting up the frontend ELK nodes.
ELK (Elasticsearch, Logstash and Kibana) Nodes (logstash-1, logstash-2):
Now we are ready to set up our ELK frontend nodes and again I have a
script to make this process repeatable and simple. For now we will only
be setting up two ELK nodes; however you can build out as many as you
like and use this same script each time for each additional node. Just
make sure that every node-name is unique and has a DNS record associated
with it.
So to get started all you need to do is run the following on a fresh
Ubuntu 12.04LTS/14.04LTS server. And let the script setup your ELK node.
Again this script will install Elasticsearch and join the
“logstash-cluster” with master capabilities and as a data node as
a client node, install Logstash with many different filtering patterns
and inputs; as well as join the “logstash-cluster” as a client node
(From logstash output - so yes; 2 instances per ELK node will show as
clients in the ES cluster) to output all logs to and install the Kibana3
webUI configured to read from the “logstash-cluster”. These ELK nodes
will do all of the heavy lifting for logstash processing as well as
servicing Kibana requests meanwhile keeping that load off of the ES
Master/Data nodes from above (allowing them to do nothing more than
churn data).
So all that is left to do once this is done is to start pointing your
network devices to the HAProxy VIP (10.0.101.60 or logstash) for
syslog and watch the data start flowing in.
sudo apt-get install git
cd ~
git clone https://github.com/mrlesmithjr/Logstash_Kibana3
chmod +x ./Logstash_Kibana3/Cluster_Setup/Logstash-ELK-ES-Cluster-client-node.sh
sudo ./Logstash_Kibana3/Cluster_Setup/Logstash-ELK-ES-Cluster-client-node.sh
Once this has been completed make sure to go back up at the end of the
HAProxy setup and install the logstash instance on each node. Once
that has been completed you can begin to test out with only one ELK node
or you can build out a few more ELK nodes if you like. I would at least
start with two to get the full benefit of this setup.
** NOTE**
If you used different naming for your VIP hostname other than logstash
you will need to modify the following file on on each of your ELK Client
nodes for the Kibana web interface to connect to ES correctly.
You can do that by doing the following and replacing logstash with your
viphostname used for your setup…(example myloghostname)
Edit /usr/share/nginx/html/kibana/config.js and change
http://logstash:9200 to http://yourviphostname:9200
sudo nano /usr/share/nginx/html/kibana/config.js
Or you can do the following but replace yourviphostname with the actual
VIP hostname used for your setup
sed -i -e 's|^elasticsearch: "http://logstash:9200",|elasticsearch: "http://yourviphostname:9200",|' /usr/share/nginx/html/kibana/config.js
Now all that is left to do is configure your network devices to start
sending their syslogs to the HAProxy VIP and if your device supports
sending via TCP, use it . Why use it? Because you will benefit from
the load balancing of the TCP connections and there will not be any lost
events (UDP - Best effort, fast!, TCP - Guaranteed, slower; but this
type of setup will bring great results!)
Reference the port list below on configuring some of the devices that
are pre-configured during the setup.
Port List
TCP/514 Syslog (Devices supporting TCP)
UDP/514 Syslog (Devices that do not support TCP - These are captured
on the HAProxy nodes and shipped to logstash using redis)
TCP/1514 VMware ESXi
TCP/1515 VMware vCenter (Windows install or appliance) (For Windows
install use NXLog from below in device setup) (For appliance reference
device setup below)
TCP/3515 Windows Eventlog (Use NXLog setup from below in device
setup)
TCP/3525 Windows IIS Logs (Use NXLog setup from below in device setup)
Device Setup
For Windows (IIS,Eventlog and VMware vCenter logging)
install nxlog and use the
following nxlog.conf file below to replace everything in C:\Program
Files (x86)\nxlog\conf\nxlog.conf\
## Please set the ROOT to the folder your nxlog was installed into,
## otherwise it will not start.
#define ROOT C:\Program Files\nxlog
define ROOT C:\Program Files (x86)\nxlog
define ROOT_STRING C:\Program Files (x86)\\nxlog
Moduledir %ROOT%\modules
CacheDir %ROOT%\data
Pidfile %ROOT%\data\nxlog.pid
SpoolDir %ROOT%\data
LogFile %ROOT%\data\nxlog.log
# Enable json extension
<Extension json>
Module xm_json
</Extension>
<Extension syslog>
Module xm_syslog
</Extension>
<Processor buffer1>
Module pm_buffer
MaxSize 1024
Type Mem
WarnLimit 512
</Processor>
<Processor buffer2>
Module pm_buffer
MaxSize 1024
Type Mem
WarnLimit 512
</Processor>
# Nxlog internal logs
<Input internal>
Module im_internal
Exec $EventReceivedTime = integer($EventReceivedTime) / 1000000; to_json();
</Input>
# Windows Event Log
<Input eventlog>
# Uncomment im_msvistalog for Windows Vista/2008 and later
Module im_msvistalog
# Uncomment im_mseventlog for Windows XP/2000/2003
# Module im_mseventlog
Exec $EventReceivedTime = integer($EventReceivedTime) / 1000000; to_json();
</Input>
# Select the input folder where logs will be scanned
# Create the parse rule for IIS logs. You can copy these from the header of the IIS log file.
# Uncomment Extension w3c for IIS logging
#<Extension w3c>
# Module xm_csv
# Fields $date, $time, $s-ip, $cs-method, $cs-uri-stem, $cs-uri-query, $s-port, $cs-username, $c-ip, $csUser-Agent, $cs-referrer, $sc-status, $sc-substatus, $sc-win32-status, $time-taken
# FieldTypes string, string, string, string, string, string, integer, string, string, string, string, integer, integer, integer, integer
# Delimiter ' '
#</Extension>
# Convert the IIS logs to JSON and use the original event time
# Uncomment IIS_IN section if logging for IIS logging
#<Input IIS_IN>
# Module im_file
# File "C:\\inetpub\\logs\\LogFiles\\W3SVC2\\u_ex*"
# SavePos TRUE
# Exec if $raw_event =~ /^#/ drop(); \
# else \
# { \
# w3c->parse_csv(); \
# $EventTime = parsedate($date + " " + $time); \
# $SourceName = "IIS"; \
# $Message = to_json(); \
# }
#</Input>
# Uncomment vCenter_vpxd section for Windows vCenter logging
#<Input vCenter_vpxd>
# Module im_file
# File "C:\ProgramData\VMware\VMware VirtualCenter\Logs\vpxd-*.log"
# Exec $Message = $raw_event;
# SavePos TRUE
# Recursive TRUE
#</Input>
# Uncomment vCenter_vpxd_alert section for Windows vCenter logging
#<Input vCenter_vpxd_alert>
# Module im_file
# File "C:\ProgramData\VMware\VMware VirtualCenter\Logs\vpxd-alert-*.log"
# Exec $Message = $raw_event;
# SavePos TRUE
# Recursive TRUE
#</Input>
<Processor t>
Module pm_transformer
OutputFormat syslog_rfc3164
</Processor>
# Change Host below to match your naming
<Output out>
Module om_tcp
Host logstash
Port 3515
</Output>
# Change Host below to match your naming
# Uncomment IIS_Out section if using IIS logging
#<Output IIS_Out>
# Module om_tcp
# Host logstash
# Port 3525
#</Output>
# Change Host below to match your naming
# Uncomment vCenter_out section for vCenter logging
#<Output vCenter_out>
# Module om_tcp
# Host logstash
# Port 1515
#</Output>
# Output routing
<Route 1>
Path internal, eventlog => buffer1 => out
</Route>
# Uncomment Route 2 if using IIS logging
#<Route 2>
# Path IIS_In => IIS_Out
#</Route>
# Uncomment Route 3 for vCenter logging
#<Route 3>
# Path vCenter_vpxd, vCenter_vpxd_alert => t => vCenter_out
#</Route>
For VMware vCenter appliance do the following from the appliance
console.
vi /etc/syslog-ng/syslog-ng.conf
Now add the following to the end of the syslog-ng.conf file
source vpxd {
file( "/var/log/vmware/vpx/vpxd.log" follow_freq( 1) flags( no-parse)) ;
file( "/var/log/vmware/vpx/vpxd-alert.log" follow_freq( 1) flags( no-parse)) ;
file( "/var/log/vmware/vpx/vws.log" follow_freq( 1) flags( no-parse)) ;
file( "/var/log/vmware/vpx/vmware-vpxd.log" follow_freq( 1) flags( no-parse)) ;
file( "/var/log/vmware/vpx/inventoryservice/ds.log" follow_freq( 1) flags( no-parse)) ;
} ;
# Remote Syslog Host
destination remote_syslog {
tcp( "logstash" port ( 1515)) ;
} ;
#
# Log vCenter Server vpxd log remotely
log {
source ( vpxd) ;
destination( remote_syslog) ;
} ;
Now restart syslog-ng
/etc/init.d/syslog restart
For Linux (Ubuntu, etc.) I prefer rsyslog as it is installed by
default on most.
sudo nano /etc/rsyslog.d/50-default.conf
Now add the following to the end of this file
Note the ”@@” this means use TCP; whereas “@” means use UDP.
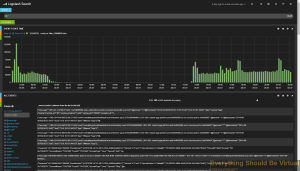
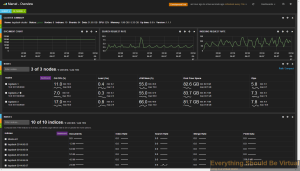
Now that your setup is complete you can browse to the Kibana webUI by
using your browser of choice
and go here .
You should see some logs showing up here now but the view is not that
great or usable so you will need to start building how you want your
dashboard to look. Or you can use some of the dashboards I have created
by clicking the load folder at the top right and go to advanced and
enter the gist number or url by using the gist url’s below (copy and
paste the https://url ). Once you load the dashboard make sure to save it
or it will be gone once you browse away.
Apache
:
{
"title": "Apache",
"services": {
"query": {
"list": {
"0": {
"id": 0,
"color": "#7EB26D",
"alias": "Exclude from Top Page Requests",
"pin": false,
"type": "lucene",
"enable": true,
"query": "*"
},
"1": {
"id": 1,
"color": "#EAB839",
"alias": "HAProxy LB",
"pin": true,
"type": "lucene",
"enable": true,
"query": "tags:\"HAProxy\""
},
"2": {
"id": 2,
"color": "#6ED0E0",
"alias": "Apache",
"pin": true,
"type": "lucene",
"enable": true,
"query": "tags:apache"
}
},
"ids": [
0,
1,
2
]
},
"filter": {
"list": {
"0": {
"type": "time",
"field": "@timestamp",
"from": "now-12h",
"to": "now",
"mandate": "must",
"active": true,
"alias": "",
"id": 0
},
"1": {
"type": "querystring",
"query": "tags:apache OR tags:haproxy",
"mandate": "must",
"active": true,
"alias": "",
"id": 1
}
},
"ids": [
0,
1
]
}
},
"rows": [
{
"title": "Graph",
"height": "175px",
"editable": true,
"collapse": false,
"collapsable": true,
"panels": [
{
"span": 12,
"editable": true,
"group": [
"default"
],
"type": "histogram",
"mode": "count",
"time_field": "@timestamp",
"value_field": null,
"auto_int": true,
"resolution": 100,
"interval": "5m",
"fill": 3,
"linewidth": 3,
"timezone": "browser",
"spyable": true,
"zoomlinks": true,
"bars": true,
"stack": false,
"points": false,
"lines": false,
"legend": true,
"x-axis": true,
"y-axis": true,
"percentage": false,
"interactive": true,
"queries": {
"mode": "unpinned",
"ids": [
0
]
},
"title": "Events over time",
"intervals": [
"auto",
"1s",
"1m",
"5m",
"10m",
"30m",
"1h",
"3h",
"12h",
"1d",
"1w",
"1M",
"1y"
],
"options": true,
"tooltip": {
"value_type": "cumulative",
"query_as_alias": true
},
"scale": 1,
"y_format": "none",
"grid": {
"max": null,
"min": 0
},
"annotate": {
"enable": false,
"query": "*",
"size": 20,
"field": "_type",
"sort": [
"_score",
"desc"
]
},
"pointradius": 5,
"show_query": true,
"legend_counts": true,
"zerofill": true,
"derivative": false
},
{
"error": false,
"span": 3,
"editable": true,
"type": "terms",
"loadingEditor": false,
"field": "@source_host",
"exclude": [],
"missing": false,
"other": false,
"size": 10,
"order": "count",
"style": {
"font-size": "10pt"
},
"donut": false,
"tilt": false,
"labels": true,
"arrangement": "horizontal",
"chart": "bar",
"counter_pos": "above",
"spyable": true,
"queries": {
"mode": "selected",
"ids": [
2
]
},
"tmode": "terms",
"tstat": "total",
"valuefield": "",
"title": "Top Servers"
},
{
"error": false,
"span": 4,
"editable": true,
"type": "terms",
"loadingEditor": false,
"field": "response",
"exclude": [
""
],
"missing": false,
"other": false,
"size": 10,
"order": "count",
"style": {
"font-size": "10pt"
},
"donut": false,
"tilt": false,
"labels": true,
"arrangement": "horizontal",
"chart": "bar",
"counter_pos": "above",
"spyable": true,
"queries": {
"mode": "selected",
"ids": [
2
]
},
"tmode": "terms",
"tstat": "total",
"valuefield": "",
"title": "Response Codes"
},
{
"error": false,
"span": 5,
"editable": true,
"type": "terms",
"loadingEditor": false,
"field": "src_ip",
"exclude": [
""
],
"missing": false,
"other": false,
"size": 10,
"order": "count",
"style": {
"font-size": "10pt"
},
"donut": false,
"tilt": false,
"labels": true,
"arrangement": "horizontal",
"chart": "bar",
"counter_pos": "above",
"spyable": true,
"queries": {
"mode": "selected",
"ids": [
2
]
},
"tmode": "terms",
"tstat": "total",
"valuefield": "",
"title": "Top 10 Client IP's"
},
{
"error": false,
"span": 4,
"editable": true,
"type": "terms",
"loadingEditor": false,
"field": "geoip.country_name",
"exclude": [],
"missing": false,
"other": false,
"size": 10,
"order": "count",
"style": {
"font-size": "10pt"
},
"donut": false,
"tilt": false,
"labels": true,
"arrangement": "horizontal",
"chart": "pie",
"counter_pos": "above",
"spyable": true,
"queries": {
"mode": "selected",
"ids": [
2
]
},
"tmode": "terms",
"tstat": "total",
"valuefield": "",
"title": "Top 10 Countries"
},
{
"error": false,
"span": 4,
"editable": true,
"type": "terms",
"loadingEditor": false,
"field": "geoip.real_region_name",
"exclude": [],
"missing": false,
"other": false,
"size": 10,
"order": "count",
"style": {
"font-size": "10pt"
},
"donut": false,
"tilt": false,
"labels": true,
"arrangement": "horizontal",
"chart": "bar",
"counter_pos": "above",
"spyable": true,
"queries": {
"mode": "selected",
"ids": [
2
]
},
"tmode": "terms",
"tstat": "total",
"valuefield": "",
"title": "Top 10 States"
},
{
"error": false,
"span": 4,
"editable": true,
"type": "terms",
"loadingEditor": false,
"field": "geoip.city_name",
"exclude": [],
"missing": false,
"other": false,
"size": 10,
"order": "count",
"style": {
"font-size": "10pt"
},
"donut": false,
"tilt": false,
"labels": true,
"arrangement": "horizontal",
"chart": "pie",
"counter_pos": "above",
"spyable": true,
"queries": {
"mode": "selected",
"ids": [
2
]
},
"tmode": "terms",
"tstat": "total",
"valuefield": "",
"title": "Top 10 Cities"
},
{
"error": false,
"span": 4,
"editable": true,
"type": "terms",
"loadingEditor": false,
"field": "method",
"exclude": [],
"missing": false,
"other": false,
"size": 10,
"order": "count",
"style": {
"font-size": "10pt"
},
"donut": false,
"tilt": false,
"labels": true,
"arrangement": "horizontal",
"chart": "pie",
"counter_pos": "above",
"spyable": true,
"queries": {
"mode": "selected",
"ids": [
2
]
},
"tmode": "terms",
"tstat": "total",
"valuefield": "",
"title": "Top Methods"
},
{
"error": false,
"span": 4,
"editable": true,
"type": "terms",
"loadingEditor": false,
"field": "apache_vhost",
"exclude": [],
"missing": false,
"other": false,
"size": 10,
"order": "count",
"style": {
"font-size": "10pt"
},
"donut": false,
"tilt": false,
"labels": true,
"arrangement": "horizontal",
"chart": "bar",
"counter_pos": "none",
"spyable": true,
"queries": {
"mode": "selected",
"ids": [
2
]
},
"tmode": "terms",
"tstat": "total",
"valuefield": "",
"title": "Top vHosts"
},
{
"error": false,
"span": 4,
"editable": true,
"type": "terms",
"loadingEditor": false,
"field": "response.raw",
"exclude": [],
"missing": false,
"other": false,
"size": 10,
"order": "count",
"style": {
"font-size": "10pt"
},
"donut": false,
"tilt": false,
"labels": true,
"arrangement": "horizontal",
"chart": "bar",
"counter_pos": "above",
"spyable": true,
"queries": {
"mode": "selected",
"ids": [
2
]
},
"tmode": "terms",
"tstat": "total",
"valuefield": "",
"title": "Response Codes"
},
{
"span": 4,
"editable": true,
"type": "histogram",
"loadingEditor": false,
"mode": "mean",
"time_field": "@timestamp",
"value_field": "bytes",
"x-axis": true,
"y-axis": true,
"scale": 1,
"y_format": "bytes",
"grid": {
"max": null,
"min": 0
},
"queries": {
"mode": "selected",
"ids": [
2
]
},
"annotate": {
"enable": false,
"query": "*",
"size": 20,
"field": "_type",
"sort": [
"_score",
"desc"
]
},
"auto_int": true,
"resolution": 100,
"interval": "5m",
"intervals": [
"auto",
"1s",
"1m",
"5m",
"10m",
"30m",
"1h",
"3h",
"12h",
"1d",
"1w",
"1y"
],
"lines": true,
"fill": 3,
"linewidth": 3,
"points": false,
"pointradius": 5,
"bars": false,
"stack": false,
"spyable": true,
"zoomlinks": true,
"options": true,
"legend": false,
"show_query": true,
"interactive": true,
"legend_counts": true,
"timezone": "browser",
"percentage": false,
"zerofill": true,
"derivative": false,
"tooltip": {
"value_type": "cumulative",
"query_as_alias": true
},
"title": "bytes transferred"
},
{
"error": false,
"span": 4,
"editable": true,
"type": "terms",
"loadingEditor": false,
"field": "referrer",
"exclude": [],
"missing": false,
"other": false,
"size": 10,
"order": "count",
"style": {
"font-size": "10pt"
},
"donut": false,
"tilt": false,
"labels": true,
"arrangement": "horizontal",
"chart": "bar",
"counter_pos": "none",
"spyable": true,
"queries": {
"mode": "selected",
"ids": [
2
]
},
"tmode": "terms",
"tstat": "total",
"valuefield": "",
"title": "Top 10 Referrers"
},
{
"error": false,
"span": 4,
"editable": true,
"type": "terms",
"loadingEditor": false,
"field": "agent",
"exclude": [
""
],
"missing": false,
"other": false,
"size": 10,
"order": "count",
"style": {
"font-size": "10pt"
},
"donut": false,
"tilt": false,
"labels": true,
"arrangement": "horizontal",
"chart": "bar",
"counter_pos": "none",
"spyable": true,
"queries": {
"mode": "selected",
"ids": [
2
]
},
"tmode": "terms",
"tstat": "total",
"valuefield": "",
"title": "Top Client Agents"
},
{
"error": false,
"span": 4,
"editable": true,
"type": "terms",
"loadingEditor": false,
"field": "request",
"exclude": [
""
],
"missing": false,
"other": false,
"size": 10,
"order": "count",
"style": {
"font-size": "8pt"
},
"donut": false,
"tilt": false,
"labels": true,
"arrangement": "horizontal",
"chart": "table",
"counter_pos": "above",
"spyable": true,
"queries": {
"mode": "selected",
"ids": [
2
]
},
"tmode": "terms",
"tstat": "total",
"valuefield": "",
"title": "Top Page Requests"
},
{
"error": false,
"span": 4,
"editable": true,
"type": "terms",
"loadingEditor": false,
"field": "@source_host",
"exclude": [],
"missing": false,
"other": false,
"size": 10,
"order": "count",
"style": {
"font-size": "10pt"
},
"donut": false,
"tilt": false,
"labels": true,
"arrangement": "horizontal",
"chart": "bar",
"counter_pos": "above",
"spyable": true,
"queries": {
"mode": "selected",
"ids": [
1
]
},
"tmode": "terms",
"tstat": "total",
"valuefield": "",
"title": "load balancer"
},
{
"error": false,
"span": 4,
"editable": true,
"type": "map",
"loadingEditor": false,
"map": "world",
"colors": [
"#A0E2E2",
"#265656"
],
"size": 100,
"exclude": [],
"spyable": true,
"queries": {
"mode": "selected",
"ids": [
2
]
},
"field": "geoip.country_code2"
}
],
"notice": false
},
{
"title": "Events",
"height": "350px",
"editable": true,
"collapse": false,
"collapsable": true,
"panels": [
{
"title": "All events",
"error": false,
"span": 12,
"editable": true,
"group": [
"default"
],
"type": "table",
"size": 100,
"pages": 5,
"offset": 0,
"sort": [
"@timestamp",
"desc"
],
"style": {
"font-size": "9pt"
},
"overflow": "min-height",
"fields": [
"@timestamp",
"@source_host",
"@message",
"apache_vhost",
"src_ip",
"method",
"request",
"response"
],
"localTime": true,
"timeField": "@timestamp",
"highlight": [],
"sortable": true,
"header": true,
"paging": true,
"spyable": true,
"queries": {
"mode": "selected",
"ids": [
1,
2
]
},
"field_list": true,
"status": "Stable",
"trimFactor": 300,
"normTimes": true,
"all_fields": false
}
],
"notice": false
}
],
"editable": true,
"failover": false,
"index": {
"interval": "day",
"pattern": "[logstash-]YYYY.MM.DD",
"default": "NO_TIME_FILTER_OR_INDEX_PATTERN_NOT_MATCHED",
"warm_fields": true
},
"style": "dark",
"panel_hints": true,
"pulldowns": [
{
"type": "query",
"collapse": true,
"notice": false,
"query": "*",
"pinned": true,
"history": [
"tags:apache",
"tags:\"HAProxy\"",
"*",
"type: \"apache\"",
"\"HAProxy\" IN TAGS",
"type = \"apache\"",
"TYPE = \"apache\"",
"\"apache\" IN TAGS",
"[\"apache\"] IN TAGS",
"TAGS: [\"apache\"]"
],
"remember": 10,
"enable": true
},
{
"type": "filtering",
"collapse": true,
"notice": true,
"enable": true
}
],
"nav": [
{
"type": "timepicker",
"collapse": false,
"notice": false,
"status": "Stable",
"time_options": [
"5m",
"15m",
"1h",
"6h",
"12h",
"24h",
"2d",
"7d",
"30d"
],
"refresh_intervals": [
"5s",
"10s",
"30s",
"1m",
"5m",
"15m",
"30m",
"1h",
"2h",
"1d"
],
"timefield": "@timestamp",
"now": true,
"filter_id": 0,
"enable": true
}
],
"loader": {
"save_gist": false,
"save_elasticsearch": true,
"save_local": true,
"save_default": true,
"save_temp": true,
"save_temp_ttl_enable": true,
"save_temp_ttl": "30d",
"load_gist": true,
"load_elasticsearch": true,
"load_elasticsearch_size": 20,
"load_local": true,
"hide": false
},
"refresh": "5m"
}
Windows IIS
:
{
"title": "IIS",
"services": {
"query": {
"list": {
"0": {
"query": "agent:MSIE",
"alias": "",
"color": "#806EB7",
"id": 0,
"pin": true,
"type": "lucene",
"enable": true
},
"1": {
"id": 1,
"color": "#EAB839",
"alias": "",
"pin": true,
"type": "lucene",
"enable": true,
"query": "agent:firefox"
},
"2": {
"id": 2,
"color": "#6ED0E0",
"alias": "",
"pin": true,
"type": "lucene",
"enable": true,
"query": "agent:chrome"
},
"3": {
"id": 3,
"color": "#EF843C",
"alias": "",
"pin": true,
"type": "lucene",
"enable": true,
"query": "agent:safari"
},
"4": {
"id": 4,
"color": "#E24D42",
"alias": "",
"pin": true,
"type": "lucene",
"enable": true,
"query": "agent:opera"
},
"5": {
"id": 5,
"color": "#7EB26D",
"alias": "",
"pin": false,
"type": "lucene",
"enable": true,
"query": "*"
}
},
"ids": [
0,
1,
2,
3,
4,
5
]
},
"filter": {
"list": {
"0": {
"type": "time",
"field": "@timestamp",
"from": "now-24h",
"to": "now",
"mandate": "must",
"active": true,
"alias": "",
"id": 0
},
"1": {
"type": "field",
"field": "tags",
"query": "\"IIS\"",
"mandate": "must",
"active": true,
"alias": "",
"id": 1
}
},
"ids": [
0,
1
]
}
},
"rows": [
{
"title": "Graph",
"height": "175px",
"editable": true,
"collapse": false,
"collapsable": true,
"panels": [
{
"span": 12,
"editable": true,
"group": [
"default"
],
"type": "histogram",
"mode": "count",
"time_field": "@timestamp",
"value_field": null,
"auto_int": true,
"resolution": 100,
"interval": "10m",
"fill": 3,
"linewidth": 3,
"timezone": "browser",
"spyable": true,
"zoomlinks": true,
"bars": true,
"stack": false,
"points": false,
"lines": false,
"legend": true,
"x-axis": true,
"y-axis": true,
"percentage": false,
"interactive": true,
"queries": {
"mode": "unpinned",
"ids": [
5
]
},
"title": "Events over time",
"intervals": [
"auto",
"1s",
"1m",
"5m",
"10m",
"30m",
"1h",
"3h",
"12h",
"1d",
"1w",
"1M",
"1y"
],
"options": true,
"tooltip": {
"value_type": "cumulative",
"query_as_alias": true
},
"scale": 1,
"y_format": "none",
"grid": {
"max": null,
"min": 0
},
"annotate": {
"enable": false,
"query": "*",
"size": 20,
"field": "_type",
"sort": [
"_score",
"desc"
]
},
"pointradius": 5,
"show_query": true,
"legend_counts": true,
"zerofill": true,
"derivative": false
},
{
"error": false,
"span": 3,
"editable": true,
"type": "terms",
"loadingEditor": false,
"field": "@source_host",
"exclude": [],
"missing": false,
"other": false,
"size": 10,
"order": "count",
"style": {
"font-size": "10pt"
},
"donut": false,
"tilt": false,
"labels": true,
"arrangement": "horizontal",
"chart": "bar",
"counter_pos": "above",
"spyable": true,
"queries": {
"mode": "unpinned",
"ids": [
5
]
},
"tmode": "terms",
"tstat": "total",
"valuefield": "",
"title": "Top Servers"
},
{
"error": false,
"span": 4,
"editable": true,
"type": "terms",
"loadingEditor": false,
"field": "response",
"exclude": [
""
],
"missing": false,
"other": false,
"size": 10,
"order": "count",
"style": {
"font-size": "10pt"
},
"donut": false,
"tilt": false,
"labels": true,
"arrangement": "horizontal",
"chart": "bar",
"counter_pos": "above",
"spyable": true,
"queries": {
"mode": "unpinned",
"ids": [
5
]
},
"tmode": "terms",
"tstat": "total",
"valuefield": "",
"title": "Response Codes"
},
{
"error": false,
"span": 5,
"editable": true,
"type": "terms",
"loadingEditor": false,
"field": "src_ip",
"exclude": [
"192.168.1.1"
],
"missing": false,
"other": false,
"size": 10,
"order": "count",
"style": {
"font-size": "10pt"
},
"donut": false,
"tilt": false,
"labels": true,
"arrangement": "horizontal",
"chart": "bar",
"counter_pos": "above",
"spyable": true,
"queries": {
"mode": "unpinned",
"ids": [
5
]
},
"tmode": "terms",
"tstat": "total",
"valuefield": "",
"title": "Top Client IP's"
},
{
"error": false,
"span": 4,
"editable": true,
"type": "terms",
"loadingEditor": false,
"field": "geoip.country_code3",
"exclude": [],
"missing": false,
"other": false,
"size": 10,
"order": "count",
"style": {
"font-size": "10pt"
},
"donut": false,
"tilt": false,
"labels": true,
"arrangement": "horizontal",
"chart": "bar",
"counter_pos": "above",
"spyable": true,
"queries": {
"mode": "unpinned",
"ids": [
5
]
},
"tmode": "terms",
"tstat": "total",
"valuefield": "",
"title": "Top Countries"
},
{
"error": false,
"span": 4,
"editable": true,
"type": "terms",
"loadingEditor": false,
"field": "geoip.city_name",
"exclude": [],
"missing": false,
"other": false,
"size": 10,
"order": "count",
"style": {
"font-size": "10pt"
},
"donut": false,
"tilt": false,
"labels": true,
"arrangement": "horizontal",
"chart": "bar",
"counter_pos": "above",
"spyable": true,
"queries": {
"mode": "all",
"ids": [
0,
1,
2,
3,
4,
5
]
},
"tmode": "terms",
"tstat": "total",
"valuefield": "",
"title": "Top Cities"
},
{
"error": false,
"span": 4,
"editable": true,
"type": "terms",
"loadingEditor": false,
"field": "method",
"exclude": [],
"missing": false,
"other": false,
"size": 10,
"order": "count",
"style": {
"font-size": "10pt"
},
"donut": false,
"tilt": false,
"labels": true,
"arrangement": "horizontal",
"chart": "bar",
"counter_pos": "above",
"spyable": true,
"queries": {
"mode": "unpinned",
"ids": [
5
]
},
"tmode": "terms",
"tstat": "total",
"valuefield": "",
"title": "Top Methods"
},
{
"error": false,
"span": 4,
"editable": true,
"type": "terms",
"loadingEditor": false,
"field": "agent",
"exclude": [
""
],
"missing": false,
"other": false,
"size": 10,
"order": "count",
"style": {
"font-size": "10pt"
},
"donut": false,
"tilt": false,
"labels": true,
"arrangement": "horizontal",
"chart": "bar",
"counter_pos": "above",
"spyable": true,
"queries": {
"mode": "unpinned",
"ids": [
5
]
},
"tmode": "terms",
"tstat": "total",
"valuefield": "",
"title": "Top Client Browsers"
},
{
"span": 4,
"editable": true,
"type": "histogram",
"loadingEditor": false,
"mode": "mean",
"time_field": "@timestamp",
"value_field": "time_request",
"x-axis": true,
"y-axis": true,
"scale": 1,
"y_format": "none",
"grid": {
"max": null,
"min": 0
},
"queries": {
"mode": "unpinned",
"ids": [
5
]
},
"annotate": {
"enable": false,
"query": "*",
"size": 20,
"field": "_type",
"sort": [
"_score",
"desc"
]
},
"auto_int": true,
"resolution": 100,
"interval": "10m",
"intervals": [
"auto",
"1s",
"1m",
"5m",
"10m",
"30m",
"1h",
"3h",
"12h",
"1d",
"1w",
"1y"
],
"lines": true,
"fill": 3,
"linewidth": 3,
"points": false,
"pointradius": 5,
"bars": false,
"stack": false,
"spyable": true,
"zoomlinks": true,
"options": true,
"legend": false,
"show_query": true,
"interactive": true,
"legend_counts": true,
"timezone": "browser",
"percentage": false,
"zerofill": true,
"derivative": false,
"tooltip": {
"value_type": "cumulative",
"query_as_alias": true
},
"title": "request time"
},
{
"error": false,
"span": 4,
"editable": true,
"type": "terms",
"loadingEditor": false,
"field": "request",
"exclude": [],
"missing": false,
"other": false,
"size": 10,
"order": "count",
"style": {
"font-size": "8pt"
},
"donut": false,
"tilt": false,
"labels": true,
"arrangement": "horizontal",
"chart": "table",
"counter_pos": "above",
"spyable": true,
"queries": {
"mode": "unpinned",
"ids": [
5
]
},
"tmode": "terms",
"tstat": "total",
"valuefield": "",
"title": "top page requests"
}
],
"notice": false
},
{
"title": "Events",
"height": "350px",
"editable": true,
"collapse": false,
"collapsable": true,
"panels": [
{
"title": "All events",
"error": false,
"span": 12,
"editable": true,
"group": [
"default"
],
"type": "table",
"size": 100,
"pages": 5,
"offset": 0,
"sort": [
"@timestamp",
"desc"
],
"style": {
"font-size": "9pt"
},
"overflow": "min-height",
"fields": [
"@timestamp",
"@source_host",
"@message",
"src_ip",
"method",
"request",
"response"
],
"localTime": true,
"timeField": "@timestamp",
"highlight": [],
"sortable": true,
"header": true,
"paging": true,
"spyable": true,
"queries": {
"mode": "unpinned",
"ids": [
5
]
},
"field_list": true,
"status": "Stable",
"trimFactor": 300,
"normTimes": true,
"all_fields": false
}
],
"notice": false
}
],
"editable": true,
"failover": false,
"index": {
"interval": "day",
"pattern": "[logstash-]YYYY.MM.DD",
"default": "NO_TIME_FILTER_OR_INDEX_PATTERN_NOT_MATCHED",
"warm_fields": true
},
"style": "dark",
"panel_hints": true,
"pulldowns": [
{
"type": "query",
"collapse": true,
"notice": false,
"query": "*",
"pinned": true,
"history": [
"*",
"agent:opera",
"agent:safari",
"agent:chrome",
"agent:firefox",
"agent:MSIE",
"agent:\"firefox\"",
"agent:\"MSIE\"",
"host:\"web-1\"",
"host:\"web-2\""
],
"remember": 10,
"enable": true
},
{
"type": "filtering",
"collapse": true,
"notice": false,
"enable": true
}
],
"nav": [
{
"type": "timepicker",
"collapse": false,
"notice": false,
"status": "Stable",
"time_options": [
"5m",
"15m",
"1h",
"6h",
"12h",
"24h",
"2d",
"7d",
"30d"
],
"refresh_intervals": [
"5s",
"10s",
"30s",
"1m",
"5m",
"15m",
"30m",
"1h",
"2h",
"1d"
],
"timefield": "@timestamp",
"now": true,
"filter_id": 0,
"enable": true
}
],
"loader": {
"save_gist": false,
"save_elasticsearch": true,
"save_local": true,
"save_default": true,
"save_temp": true,
"save_temp_ttl_enable": true,
"save_temp_ttl": "30d",
"load_gist": true,
"load_elasticsearch": true,
"load_elasticsearch_size": 20,
"load_local": true,
"hide": false
},
"refresh": "5m"
}
Nginx
:
{
"title": "Nginx",
"services": {
"query": {
"list": {
"0": {
"id": 0,
"color": "#7EB26D",
"alias": "Exclude from Top Page Requests",
"pin": false,
"type": "lucene",
"enable": true,
"query": "*"
},
"1": {
"id": 1,
"color": "#EAB839",
"alias": "",
"pin": true,
"type": "lucene",
"enable": true,
"query": "100"
},
"2": {
"id": 2,
"color": "#6ED0E0",
"alias": "",
"pin": true,
"type": "lucene",
"enable": true,
"query": "101"
},
"3": {
"id": 3,
"color": "#EF843C",
"alias": "",
"pin": true,
"type": "lucene",
"enable": true,
"query": "200"
},
"4": {
"id": 4,
"color": "#E24D42",
"alias": "",
"pin": true,
"type": "lucene",
"enable": true,
"query": "201"
},
"5": {
"id": 5,
"color": "#1F78C1",
"alias": "",
"pin": true,
"type": "lucene",
"enable": true,
"query": "202"
},
"6": {
"id": 6,
"color": "#BA43A9",
"alias": "",
"pin": true,
"type": "lucene",
"enable": true,
"query": "203"
},
"7": {
"id": 7,
"color": "#705DA0",
"alias": "",
"pin": true,
"type": "lucene",
"enable": true,
"query": "204"
},
"8": {
"id": 8,
"color": "#508642",
"alias": "",
"pin": true,
"type": "lucene",
"enable": true,
"query": "205"
},
"9": {
"id": 9,
"color": "#CCA300",
"alias": "",
"pin": true,
"type": "lucene",
"enable": true,
"query": "206"
},
"10": {
"id": 10,
"color": "#447EBC",
"alias": "",
"pin": true,
"type": "lucene",
"enable": true,
"query": "300"
},
"11": {
"id": 11,
"color": "#C15C17",
"alias": "",
"pin": true,
"type": "lucene",
"enable": true,
"query": "301"
},
"12": {
"id": 12,
"color": "#890F02",
"alias": "",
"pin": true,
"type": "lucene",
"enable": true,
"query": "302"
},
"13": {
"id": 13,
"color": "#0A437C",
"alias": "",
"pin": true,
"type": "lucene",
"enable": true,
"query": "303"
},
"14": {
"id": 14,
"color": "#6D1F62",
"alias": "",
"pin": true,
"type": "lucene",
"enable": true,
"query": "304"
},
"15": {
"id": 15,
"color": "#584477",
"alias": "",
"pin": true,
"type": "lucene",
"enable": true,
"query": "305"
},
"16": {
"id": 16,
"color": "#B7DBAB",
"alias": "",
"pin": true,
"type": "lucene",
"enable": true,
"query": "306"
},
"17": {
"id": 17,
"color": "#F4D598",
"alias": "",
"pin": true,
"type": "lucene",
"enable": true,
"query": "307"
},
"18": {
"id": 18,
"color": "#70DBED",
"alias": "",
"pin": true,
"type": "lucene",
"enable": true,
"query": "400"
},
"19": {
"id": 19,
"color": "#F9BA8F",
"alias": "",
"pin": true,
"type": "lucene",
"enable": true,
"query": "401"
},
"20": {
"id": 20,
"color": "#F29191",
"alias": "",
"pin": true,
"type": "lucene",
"enable": true,
"query": "402"
},
"21": {
"id": 21,
"color": "#82B5D8",
"alias": "",
"pin": true,
"type": "lucene",
"enable": true,
"query": "403"
},
"22": {
"id": 22,
"color": "#E5A8E2",
"alias": "",
"pin": true,
"type": "lucene",
"enable": true,
"query": "404"
},
"23": {
"id": 23,
"color": "#AEA2E0",
"alias": "",
"pin": true,
"type": "lucene",
"enable": true,
"query": "405"
},
"24": {
"id": 24,
"color": "#629E51",
"alias": "",
"pin": true,
"type": "lucene",
"enable": true,
"query": "406"
},
"25": {
"id": 25,
"color": "#E5AC0E",
"alias": "",
"pin": true,
"type": "lucene",
"enable": true,
"query": "407"
},
"26": {
"id": 26,
"color": "#64B0C8",
"alias": "",
"pin": true,
"type": "lucene",
"enable": true,
"query": "408"
},
"27": {
"id": 27,
"color": "#E0752D",
"alias": "",
"pin": true,
"type": "lucene",
"enable": true,
"query": "409"
},
"28": {
"id": 28,
"color": "#BF1B00",
"alias": "",
"pin": true,
"type": "lucene",
"enable": true,
"query": "410"
},
"29": {
"id": 29,
"color": "#0A50A1",
"alias": "",
"pin": true,
"type": "lucene",
"enable": true,
"query": "411"
},
"30": {
"id": 30,
"color": "#962D82",
"alias": "",
"pin": true,
"type": "lucene",
"enable": true,
"query": "412"
},
"31": {
"id": 31,
"color": "#614D93",
"alias": "",
"pin": true,
"type": "lucene",
"enable": true,
"query": "413"
},
"32": {
"id": 32,
"color": "#9AC48A",
"alias": "",
"pin": true,
"type": "lucene",
"enable": true,
"query": "414"
},
"33": {
"id": 33,
"color": "#F2C96D",
"alias": "",
"pin": true,
"type": "lucene",
"enable": true,
"query": "415"
},
"34": {
"id": 34,
"color": "#65C5DB",
"alias": "",
"pin": true,
"type": "lucene",
"enable": true,
"query": "416"
},
"35": {
"id": 35,
"color": "#F9934E",
"alias": "",
"pin": true,
"type": "lucene",
"enable": true,
"query": "417"
},
"36": {
"id": 36,
"color": "#EA6460",
"alias": "",
"pin": true,
"type": "lucene",
"enable": true,
"query": "500"
},
"37": {
"id": 37,
"color": "#5195CE",
"alias": "",
"pin": true,
"type": "lucene",
"enable": true,
"query": "501"
},
"38": {
"id": 38,
"color": "#D683CE",
"alias": "",
"pin": true,
"type": "lucene",
"enable": true,
"query": "502"
},
"39": {
"id": 39,
"color": "#806EB7",
"alias": "",
"pin": true,
"type": "lucene",
"enable": true,
"query": "503"
},
"40": {
"id": 40,
"color": "#3F6833",
"alias": "",
"pin": true,
"type": "lucene",
"enable": true,
"query": "504"
},
"41": {
"id": 41,
"color": "#967302",
"alias": "",
"pin": true,
"type": "lucene",
"enable": true,
"query": "505"
},
"42": {
"id": 42,
"color": "#2F575E",
"alias": "Nginx Errors",
"pin": true,
"type": "lucene",
"enable": true,
"query": "type: (\"nginx-error\")"
}
},
"ids": [
0,
1,
2,
3,
4,
5,
6,
7,
8,
9,
10,
11,
12,
13,
14,
15,
16,
17,
18,
19,
20,
21,
22,
23,
24,
25,
26,
27,
28,
29,
30,
31,
32,
33,
34,
35,
36,
37,
38,
39,
40,
41,
42
]
},
"filter": {
"list": {
"0": {
"type": "time",
"field": "@timestamp",
"from": "now-12h",
"to": "now",
"mandate": "must",
"active": true,
"alias": "",
"id": 0
},
"1": {
"type": "querystring",
"query": "tags:nginx",
"mandate": "must",
"active": true,
"alias": "",
"id": 1
}
},
"ids": [
0,
1
]
}
},
"rows": [
{
"title": "Graph",
"height": "175px",
"editable": true,
"collapse": false,
"collapsable": true,
"panels": [
{
"span": 12,
"editable": true,
"group": [
"default"
],
"type": "histogram",
"mode": "count",
"time_field": "@timestamp",
"value_field": null,
"auto_int": true,
"resolution": 100,
"interval": "5m",
"fill": 3,
"linewidth": 3,
"timezone": "browser",
"spyable": true,
"zoomlinks": true,
"bars": true,
"stack": false,
"points": false,
"lines": false,
"legend": true,
"x-axis": true,
"y-axis": true,
"percentage": false,
"interactive": true,
"queries": {
"mode": "unpinned",
"ids": [
0
]
},
"title": "Events over time",
"intervals": [
"auto",
"1s",
"1m",
"5m",
"10m",
"30m",
"1h",
"3h",
"12h",
"1d",
"1w",
"1M",
"1y"
],
"options": true,
"tooltip": {
"value_type": "cumulative",
"query_as_alias": true
},
"scale": 1,
"y_format": "none",
"grid": {
"max": null,
"min": 0
},
"annotate": {
"enable": false,
"query": "*",
"size": 20,
"field": "_type",
"sort": [
"_score",
"desc"
]
},
"pointradius": 5,
"show_query": true,
"legend_counts": true,
"zerofill": true,
"derivative": false
},
{
"span": 12,
"editable": true,
"type": "histogram",
"loadingEditor": false,
"mode": "count",
"time_field": "@timestamp",
"value_field": null,
"x-axis": true,
"y-axis": true,
"scale": 1,
"y_format": "none",
"grid": {
"max": null,
"min": 0
},
"queries": {
"mode": "selected",
"ids": [
1,
2,
3,
4,
5,
6,
7,
8,
9,
10,
11,
12,
13,
14,
15,
16,
17,
18,
19,
20,
21,
22,
23,
24,
25,
26,
27,
28,
29,
30,
31,
32,
33,
34,
35,
36,
37,
38,
39,
40,
41
]
},
"annotate": {
"enable": false,
"query": "*",
"size": 20,
"field": "_type",
"sort": [
"_score",
"desc"
]
},
"auto_int": true,
"resolution": 100,
"interval": "5m",
"intervals": [
"auto",
"1s",
"1m",
"5m",
"10m",
"30m",
"1h",
"3h",
"12h",
"1d",
"1w",
"1y"
],
"lines": true,
"fill": 3,
"linewidth": 3,
"points": false,
"pointradius": 5,
"bars": false,
"stack": false,
"spyable": true,
"zoomlinks": true,
"options": true,
"legend": true,
"show_query": true,
"interactive": true,
"legend_counts": true,
"timezone": "browser",
"percentage": false,
"zerofill": true,
"derivative": false,
"tooltip": {
"value_type": "cumulative",
"query_as_alias": true
},
"title": "http responses"
},
{
"error": false,
"span": 4,
"editable": true,
"type": "terms",
"loadingEditor": false,
"field": "@source_host",
"exclude": [],
"missing": false,
"other": false,
"size": 10,
"order": "count",
"style": {
"font-size": "10pt"
},
"donut": false,
"tilt": false,
"labels": true,
"arrangement": "horizontal",
"chart": "bar",
"counter_pos": "above",
"spyable": true,
"queries": {
"mode": "unpinned",
"ids": [
0
]
},
"tmode": "terms",
"tstat": "total",
"valuefield": "",
"title": "Top Servers"
},
{
"error": false,
"span": 4,
"editable": true,
"type": "terms",
"loadingEditor": false,
"field": "src_ip",
"exclude": [
""
],
"missing": false,
"other": false,
"size": 10,
"order": "count",
"style": {
"font-size": "10pt"
},
"donut": false,
"tilt": false,
"labels": true,
"arrangement": "horizontal",
"chart": "bar",
"counter_pos": "above",
"spyable": true,
"queries": {
"mode": "unpinned",
"ids": [
0
]
},
"tmode": "terms",
"tstat": "total",
"valuefield": "",
"title": "Top 10 Client IP's"
},
{
"error": false,
"span": 4,
"editable": true,
"type": "terms",
"loadingEditor": false,
"field": "geoip.country_code3",
"exclude": [],
"missing": false,
"other": false,
"size": 10,
"order": "count",
"style": {
"font-size": "10pt"
},
"donut": false,
"tilt": false,
"labels": true,
"arrangement": "horizontal",
"chart": "bar",
"counter_pos": "above",
"spyable": true,
"queries": {
"mode": "unpinned",
"ids": [
0
]
},
"tmode": "terms",
"tstat": "total",
"valuefield": "",
"title": "Top 10 Countries"
},
{
"error": false,
"span": 4,
"editable": true,
"type": "terms",
"loadingEditor": false,
"field": "geoip.real_region_name",
"exclude": [],
"missing": false,
"other": false,
"size": 10,
"order": "count",
"style": {
"font-size": "10pt"
},
"donut": false,
"tilt": false,
"labels": true,
"arrangement": "horizontal",
"chart": "bar",
"counter_pos": "above",
"spyable": true,
"queries": {
"mode": "unpinned",
"ids": [
0
]
},
"tmode": "terms",
"tstat": "total",
"valuefield": "",
"title": "Top 10 States"
},
{
"error": false,
"span": 4,
"editable": true,
"type": "terms",
"loadingEditor": false,
"field": "geoip.city_name",
"exclude": [],
"missing": false,
"other": false,
"size": 10,
"order": "count",
"style": {
"font-size": "10pt"
},
"donut": false,
"tilt": false,
"labels": true,
"arrangement": "horizontal",
"chart": "bar",
"counter_pos": "above",
"spyable": true,
"queries": {
"mode": "unpinned",
"ids": [
0
]
},
"tmode": "terms",
"tstat": "total",
"valuefield": "",
"title": "Top 10 Cities"
},
{
"error": false,
"span": 4,
"editable": true,
"type": "terms",
"loadingEditor": false,
"field": "method",
"exclude": [],
"missing": false,
"other": false,
"size": 10,
"order": "count",
"style": {
"font-size": "10pt"
},
"donut": false,
"tilt": false,
"labels": true,
"arrangement": "horizontal",
"chart": "bar",
"counter_pos": "above",
"spyable": true,
"queries": {
"mode": "unpinned",
"ids": [
0
]
},
"tmode": "terms",
"tstat": "total",
"valuefield": "",
"title": "Top Methods"
},
{
"error": false,
"span": 4,
"editable": true,
"type": "terms",
"loadingEditor": false,
"field": "type",
"exclude": [],
"missing": false,
"other": false,
"size": 10,
"order": "count",
"style": {
"font-size": "10pt"
},
"donut": false,
"tilt": false,
"labels": true,
"arrangement": "horizontal",
"chart": "bar",
"counter_pos": "above",
"spyable": true,
"queries": {
"mode": "unpinned",
"ids": [
0
]
},
"tmode": "terms",
"tstat": "count",
"valuefield": "",
"title": "nginx log types"
},
{
"span": 4,
"editable": true,
"type": "histogram",
"loadingEditor": false,
"mode": "mean",
"time_field": "@timestamp",
"value_field": "bytes",
"x-axis": true,
"y-axis": true,
"scale": 1,
"y_format": "bytes",
"grid": {
"max": null,
"min": 0
},
"queries": {
"mode": "unpinned",
"ids": [
0
]
},
"annotate": {
"enable": false,
"query": "*",
"size": 20,
"field": "_type",
"sort": [
"_score",
"desc"
]
},
"auto_int": true,
"resolution": 100,
"interval": "5m",
"intervals": [
"auto",
"1s",
"1m",
"5m",
"10m",
"30m",
"1h",
"3h",
"12h",
"1d",
"1w",
"1y"
],
"lines": true,
"fill": 3,
"linewidth": 3,
"points": false,
"pointradius": 5,
"bars": false,
"stack": false,
"spyable": true,
"zoomlinks": true,
"options": true,
"legend": false,
"show_query": true,
"interactive": true,
"legend_counts": true,
"timezone": "browser",
"percentage": false,
"zerofill": true,
"derivative": false,
"tooltip": {
"value_type": "cumulative",
"query_as_alias": true
},
"title": "transferred bytes"
},
{
"error": false,
"span": 4,
"editable": true,
"type": "map",
"loadingEditor": false,
"map": "world",
"colors": [
"#A0E2E2",
"#265656"
],
"size": 100,
"exclude": [],
"spyable": true,
"queries": {
"mode": "unpinned",
"ids": [
0
]
},
"field": "geoip.country_code2",
"title": "GeoIP"
},
{
"error": false,
"span": 4,
"editable": true,
"type": "terms",
"loadingEditor": false,
"field": "agent",
"exclude": [
""
],
"missing": false,
"other": false,
"size": 10,
"order": "count",
"style": {
"font-size": "8pt"
},
"donut": false,
"tilt": false,
"labels": true,
"arrangement": "vertical",
"chart": "table",
"counter_pos": "above",
"spyable": true,
"queries": {
"mode": "unpinned",
"ids": [
0
]
},
"tmode": "terms",
"tstat": "total",
"valuefield": "",
"title": "Top Client Agents"
},
{
"error": false,
"span": 4,
"editable": true,
"type": "terms",
"loadingEditor": false,
"field": "referrer",
"exclude": [],
"missing": false,
"other": false,
"size": 10,
"order": "count",
"style": {
"font-size": "8pt"
},
"donut": false,
"tilt": false,
"labels": true,
"arrangement": "horizontal",
"chart": "table",
"counter_pos": "above",
"spyable": true,
"queries": {
"mode": "unpinned",
"ids": [
0
]
},
"tmode": "terms",
"tstat": "total",
"valuefield": "",
"title": "Top Referrers"
},
{
"error": false,
"span": 4,
"editable": true,
"type": "terms",
"loadingEditor": false,
"field": "request",
"exclude": [
""
],
"missing": false,
"other": false,
"size": 10,
"order": "count",
"style": {
"font-size": "8pt"
},
"donut": false,
"tilt": false,
"labels": true,
"arrangement": "horizontal",
"chart": "table",
"counter_pos": "above",
"spyable": true,
"queries": {
"mode": "unpinned",
"ids": [
0
]
},
"tmode": "terms",
"tstat": "total",
"valuefield": "",
"title": "Top Page Requests"
}
],
"notice": false
},
{
"title": "Events",
"height": "350px",
"editable": true,
"collapse": false,
"collapsable": true,
"panels": [
{
"title": "All events",
"error": false,
"span": 12,
"editable": true,
"group": [
"default"
],
"type": "table",
"size": 100,
"pages": 5,
"offset": 0,
"sort": [
"@timestamp",
"desc"
],
"style": {
"font-size": "9pt"
},
"overflow": "min-height",
"fields": [
"@timestamp",
"@source_host",
"@message",
"src_ip",
"method",
"request",
"response"
],
"localTime": true,
"timeField": "@timestamp",
"highlight": [],
"sortable": true,
"header": true,
"paging": true,
"spyable": true,
"queries": {
"mode": "unpinned",
"ids": [
0
]
},
"field_list": true,
"status": "Stable",
"trimFactor": 300,
"normTimes": true,
"all_fields": false
}
],
"notice": false
}
],
"editable": true,
"failover": false,
"index": {
"interval": "day",
"pattern": "[logstash-]YYYY.MM.DD",
"default": "NO_TIME_FILTER_OR_INDEX_PATTERN_NOT_MATCHED",
"warm_fields": true
},
"style": "dark",
"panel_hints": true,
"pulldowns": [
{
"type": "query",
"collapse": true,
"notice": false,
"query": "*",
"pinned": true,
"history": [
"type: (\"nginx-error\")",
"505",
"504",
"503",
"502",
"501",
"500",
"417",
"416",
"415"
],
"remember": 10,
"enable": true
},
{
"type": "filtering",
"collapse": true,
"notice": false,
"enable": true
}
],
"nav": [
{
"type": "timepicker",
"collapse": false,
"notice": false,
"status": "Stable",
"time_options": [
"5m",
"15m",
"1h",
"6h",
"12h",
"24h",
"2d",
"7d",
"30d"
],
"refresh_intervals": [
"5s",
"10s",
"30s",
"1m",
"5m",
"15m",
"30m",
"1h",
"2h",
"1d"
],
"timefield": "@timestamp",
"now": true,
"filter_id": 0,
"enable": true
}
],
"loader": {
"save_gist": false,
"save_elasticsearch": true,
"save_local": true,
"save_default": true,
"save_temp": true,
"save_temp_ttl_enable": true,
"save_temp_ttl": "30d",
"load_gist": true,
"load_elasticsearch": true,
"load_elasticsearch_size": 20,
"load_local": true,
"hide": false
},
"refresh": "5m"
}
PFsense Firewall
:
{
"title": "PFSense Firewall",
"services": {
"query": {
"idQueue": [],
"list": {
"0": {
"query": "*",
"alias": "",
"color": "#7EB26D",
"id": 0,
"pin": false,
"type": "lucene",
"enable": true
},
"1": {
"id": 1,
"color": "#EAB839",
"query": "syslog_program: \"pf\" AND action: \"block\"",
"alias": "Blocked",
"pin": true,
"type": "lucene",
"enable": true
},
"2": {
"id": 2,
"color": "#6ED0E0",
"alias": "Passed",
"pin": true,
"type": "lucene",
"enable": true,
"query": "syslog_program: \"pf\" AND action: \"pass\""
}
},
"ids": [
0,
1,
2
]
},
"filter": {
"idQueue": [
1
],
"list": {
"0": {
"type": "time",
"field": "@timestamp",
"from": "now-1h",
"to": "now",
"mandate": "must",
"active": true,
"alias": "",
"id": 0
},
"1": {
"type": "querystring",
"query": "tags:PFSense OR tags:firewall OR tags:packetfilter",
"mandate": "must",
"active": true,
"alias": "",
"id": 1
}
},
"ids": [
0,
1
]
}
},
"rows": [
{
"title": "Histogram",
"height": "150px",
"editable": true,
"collapse": false,
"collapsable": true,
"panels": [
{
"span": 12,
"editable": true,
"type": "histogram",
"loadingEditor": false,
"mode": "count",
"time_field": "@timestamp",
"queries": {
"mode": "unpinned",
"ids": [
0
]
},
"value_field": null,
"auto_int": true,
"resolution": 100,
"interval": "30s",
"intervals": [
"auto",
"1s",
"1m",
"5m",
"10m",
"30m",
"1h",
"3h",
"12h",
"1d",
"1w",
"1M",
"1y"
],
"fill": 0,
"linewidth": 3,
"timezone": "browser",
"spyable": true,
"zoomlinks": true,
"bars": true,
"stack": true,
"points": false,
"lines": false,
"legend": true,
"x-axis": true,
"y-axis": true,
"percentage": false,
"interactive": true,
"options": true,
"tooltip": {
"value_type": "cumulative",
"query_as_alias": true
},
"title": "Events By Time",
"scale": 1,
"y_format": "none",
"grid": {
"max": null,
"min": 0
},
"annotate": {
"enable": false,
"query": "*",
"size": 20,
"field": "_type",
"sort": [
"_score",
"desc"
]
},
"pointradius": 5,
"show_query": true,
"legend_counts": true,
"zerofill": true,
"derivative": false
}
],
"notice": false
},
{
"title": "Graph",
"height": "250px",
"editable": true,
"collapse": false,
"collapsable": true,
"panels": [
{
"error": false,
"span": 4,
"editable": true,
"type": "terms",
"loadingEditor": false,
"queries": {
"mode": "all",
"ids": [
0,
1,
2
]
},
"field": "syslog_program",
"exclude": [],
"missing": false,
"other": false,
"size": 10,
"order": "count",
"style": {
"font-size": "10pt"
},
"donut": false,
"tilt": false,
"labels": true,
"arrangement": "horizontal",
"chart": "bar",
"counter_pos": "above",
"spyable": true,
"title": "EventSource",
"tmode": "terms",
"tstat": "total",
"valuefield": ""
},
{
"error": false,
"span": 4,
"editable": true,
"type": "terms",
"loadingEditor": false,
"queries": {
"mode": "selected",
"ids": [
1
]
},
"field": "src_ip",
"exclude": [],
"missing": false,
"other": false,
"size": 10,
"order": "count",
"style": {
"font-size": "10pt"
},
"donut": false,
"tilt": false,
"labels": true,
"arrangement": "horizontal",
"chart": "bar",
"counter_pos": "above",
"spyable": true,
"title": "Blocked IPs",
"tmode": "terms",
"tstat": "total",
"valuefield": ""
},
{
"error": false,
"span": 4,
"editable": true,
"type": "terms",
"loadingEditor": false,
"field": "src_ip",
"exclude": [],
"missing": false,
"other": false,
"size": 10,
"order": "count",
"style": {
"font-size": "10pt"
},
"donut": false,
"tilt": false,
"labels": true,
"arrangement": "horizontal",
"chart": "bar",
"counter_pos": "above",
"spyable": true,
"queries": {
"mode": "selected",
"ids": [
2
]
},
"tmode": "terms",
"tstat": "total",
"valuefield": "",
"title": "Allowed IPs"
},
{
"error": false,
"span": 4,
"editable": true,
"type": "terms",
"loadingEditor": false,
"queries": {
"mode": "selected",
"ids": [
1
]
},
"field": "proto",
"exclude": [],
"missing": false,
"other": false,
"size": 10,
"order": "count",
"style": {
"font-size": "10pt"
},
"donut": false,
"tilt": false,
"labels": true,
"arrangement": "horizontal",
"chart": "pie",
"counter_pos": "above",
"spyable": true,
"title": "Protocol's Blocked",
"tmode": "terms",
"tstat": "total",
"valuefield": ""
},
{
"error": false,
"span": 4,
"editable": true,
"type": "terms",
"loadingEditor": false,
"field": "proto",
"exclude": [],
"missing": false,
"other": false,
"size": 10,
"order": "count",
"style": {
"font-size": "10pt"
},
"donut": false,
"tilt": false,
"labels": true,
"arrangement": "horizontal",
"chart": "pie",
"counter_pos": "above",
"spyable": true,
"queries": {
"mode": "selected",
"ids": [
2
]
},
"tmode": "terms",
"tstat": "total",
"valuefield": "",
"title": "Protocols Allowed"
},
{
"error": false,
"span": 4,
"editable": true,
"type": "terms",
"loadingEditor": false,
"queries": {
"mode": "selected",
"ids": [
1
]
},
"field": "iface",
"exclude": [],
"missing": false,
"other": false,
"size": 10,
"order": "count",
"style": {
"font-size": "10pt"
},
"donut": false,
"tilt": false,
"labels": true,
"arrangement": "horizontal",
"chart": "pie",
"counter_pos": "above",
"spyable": true,
"title": "Blocked by Interface",
"tmode": "terms",
"tstat": "total",
"valuefield": ""
},
{
"error": false,
"span": 4,
"editable": true,
"type": "terms",
"loadingEditor": false,
"field": "iface",
"exclude": [],
"missing": false,
"other": false,
"size": 10,
"order": "count",
"style": {
"font-size": "10pt"
},
"donut": false,
"tilt": false,
"labels": true,
"arrangement": "horizontal",
"chart": "pie",
"counter_pos": "above",
"spyable": true,
"queries": {
"mode": "selected",
"ids": [
2
]
},
"tmode": "terms",
"tstat": "total",
"valuefield": "",
"title": "Allowed BY Interface"
}
],
"notice": false
},
{
"title": "Events",
"height": "350px",
"editable": true,
"collapse": false,
"collapsable": true,
"panels": [
{
"title": "All events",
"error": false,
"span": 12,
"editable": true,
"group": [
"default"
],
"type": "table",
"size": 100,
"pages": 5,
"offset": 0,
"sort": [
"@timestamp",
"desc"
],
"style": {
"font-size": "9pt"
},
"overflow": "min-height",
"fields": [
"@timestamp",
"@message",
"iface",
"rule",
"syslog_program",
"src_ip",
"src_port",
"dst_ip",
"dst_port",
"action",
"proto"
],
"highlight": [],
"sortable": true,
"header": true,
"paging": true,
"spyable": true,
"queries": {
"mode": "all",
"ids": [
0,
1,
2
]
},
"field_list": true,
"status": "Stable",
"trimFactor": 700,
"normTimes": true,
"all_fields": false,
"localTime": true,
"timeField": "@timestamp"
}
],
"notice": false
}
],
"editable": true,
"failover": false,
"index": {
"interval": "day",
"pattern": "[logstash-]YYYY.MM.DD",
"default": "NO_TIME_FILTER_OR_INDEX_PATTERN_NOT_MATCHED",
"warm_fields": true
},
"style": "dark",
"panel_hints": true,
"pulldowns": [
{
"type": "query",
"collapse": true,
"notice": false,
"query": "*",
"pinned": true,
"history": [
"prog: \"pf\" AND action: \"pass\"",
"prog: \"pf\" AND action: \"block\"",
"*",
"prog==\"pf\" AND action==\"block\"",
"prog==\"pf\""
],
"remember": 10,
"enable": true
},
{
"type": "filtering",
"collapse": true,
"notice": false,
"enable": true
}
],
"nav": [
{
"type": "timepicker",
"collapse": false,
"notice": false,
"status": "Stable",
"time_options": [
"5m",
"15m",
"1h",
"6h",
"12h",
"24h",
"2d",
"7d",
"30d"
],
"refresh_intervals": [
"5s",
"10s",
"30s",
"1m",
"5m",
"15m",
"30m",
"1h",
"2h",
"1d"
],
"timefield": "@timestamp",
"now": true,
"filter_id": 0,
"enable": true
}
],
"loader": {
"save_gist": false,
"save_elasticsearch": true,
"save_local": true,
"save_default": true,
"save_temp": true,
"save_temp_ttl_enable": true,
"save_temp_ttl": "30d",
"load_gist": true,
"load_elasticsearch": true,
"load_elasticsearch_size": 20,
"load_local": true,
"hide": false
},
"refresh": "5m"
}
Syslog
:
{
"title": "Syslog",
"services": {
"query": {
"list": {
"0": {
"query": "*",
"alias": "",
"color": "#7EB26D",
"id": 0,
"pin": false,
"type": "lucene",
"enable": true
},
"1": {
"id": 1,
"color": "#EAB839",
"alias": "Invalid User",
"pin": true,
"type": "lucene",
"enable": true,
"query": "\"Invalid user\""
},
"2": {
"id": 2,
"color": "#6ED0E0",
"alias": "Failed Password",
"pin": true,
"type": "lucene",
"enable": true,
"query": "\"Failed password\""
}
},
"ids": [
0,
1,
2
]
},
"filter": {
"list": {
"0": {
"type": "time",
"field": "@timestamp",
"from": "now-12h",
"to": "now",
"mandate": "must",
"active": true,
"alias": "",
"id": 0
},
"1": {
"type": "terms",
"field": "tags",
"value": "syslog",
"mandate": "must",
"active": true,
"alias": "",
"id": 1
}
},
"ids": [
0,
1
]
}
},
"rows": [
{
"title": "Graph",
"height": "175px",
"editable": true,
"collapse": false,
"collapsable": true,
"panels": [
{
"span": 12,
"editable": true,
"group": [
"default"
],
"type": "histogram",
"mode": "count",
"time_field": "@timestamp",
"value_field": null,
"auto_int": true,
"resolution": 100,
"interval": "5m",
"fill": 3,
"linewidth": 3,
"timezone": "browser",
"spyable": true,
"zoomlinks": true,
"bars": true,
"stack": false,
"points": false,
"lines": false,
"legend": true,
"x-axis": true,
"y-axis": true,
"percentage": false,
"interactive": true,
"queries": {
"mode": "unpinned",
"ids": [
0
]
},
"title": "Events over time",
"intervals": [
"auto",
"1s",
"1m",
"5m",
"10m",
"30m",
"1h",
"3h",
"12h",
"1d",
"1w",
"1M",
"1y"
],
"options": true,
"tooltip": {
"value_type": "cumulative",
"query_as_alias": true
},
"scale": 1,
"y_format": "none",
"grid": {
"max": null,
"min": 0
},
"annotate": {
"enable": false,
"query": "*",
"size": 20,
"field": "_type",
"sort": [
"_score",
"desc"
]
},
"pointradius": 5,
"show_query": true,
"legend_counts": true,
"zerofill": true,
"derivative": false
},
{
"error": false,
"span": 4,
"editable": true,
"type": "terms",
"loadingEditor": false,
"field": "syslog_severity",
"exclude": [],
"missing": false,
"other": false,
"size": 10,
"order": "count",
"style": {
"font-size": "10pt"
},
"donut": false,
"tilt": false,
"labels": true,
"arrangement": "horizontal",
"chart": "bar",
"counter_pos": "above",
"spyable": true,
"queries": {
"mode": "unpinned",
"ids": [
0
]
},
"tmode": "terms",
"tstat": "total",
"valuefield": "",
"title": "Syslog Severities"
},
{
"error": false,
"span": 4,
"editable": true,
"type": "terms",
"loadingEditor": false,
"field": "syslog_program.raw",
"exclude": [],
"missing": false,
"other": false,
"size": 10,
"order": "count",
"style": {
"font-size": "10pt"
},
"donut": false,
"tilt": false,
"labels": true,
"arrangement": "horizontal",
"chart": "bar",
"counter_pos": "above",
"spyable": true,
"queries": {
"mode": "unpinned",
"ids": [
0
]
},
"tmode": "terms",
"tstat": "total",
"valuefield": "",
"title": "Syslog Program"
},
{
"error": false,
"span": 4,
"editable": true,
"type": "terms",
"loadingEditor": false,
"field": "@source_host",
"exclude": [],
"missing": false,
"other": false,
"size": 10,
"order": "count",
"style": {
"font-size": "10pt"
},
"donut": false,
"tilt": false,
"labels": true,
"arrangement": "horizontal",
"chart": "bar",
"counter_pos": "above",
"spyable": true,
"queries": {
"mode": "unpinned",
"ids": [
0
]
},
"tmode": "terms",
"tstat": "total",
"valuefield": "",
"title": "Top 10 Sources"
}
],
"notice": false
},
{
"title": "Events",
"height": "350px",
"editable": true,
"collapse": false,
"collapsable": true,
"panels": [
{
"title": "All events",
"error": false,
"span": 12,
"editable": true,
"group": [
"default"
],
"type": "table",
"size": 100,
"pages": 5,
"offset": 0,
"sort": [
"@timestamp",
"desc"
],
"style": {
"font-size": "9pt"
},
"overflow": "min-height",
"fields": [
"@timestamp",
"@source_host",
"@message",
"syslog_severity",
"syslog_facility",
"tags"
],
"localTime": true,
"timeField": "@timestamp",
"highlight": [],
"sortable": true,
"header": true,
"paging": true,
"spyable": true,
"queries": {
"mode": "unpinned",
"ids": [
0
]
},
"field_list": true,
"status": "Stable",
"trimFactor": 300,
"normTimes": true,
"all_fields": false
}
],
"notice": false
}
],
"editable": true,
"failover": false,
"index": {
"interval": "day",
"pattern": "[logstash-]YYYY.MM.DD",
"default": "NO_TIME_FILTER_OR_INDEX_PATTERN_NOT_MATCHED",
"warm_fields": true
},
"style": "dark",
"panel_hints": true,
"pulldowns": [
{
"type": "query",
"collapse": true,
"notice": false,
"query": "*",
"pinned": true,
"history": [
"\"Failed password\"",
"\"Invalid user\"",
"*",
"syslog_program:sshd",
"message:\"Failed password\"",
"message: \"Failed password\"",
"syslog_program:sshd AND message: \"Failed password\"",
"syslog_program:sshd AND message: \"Failed\"",
"syslog_program IS sshd AND @message CONTAINS Failed",
"syslog_program:sshd AND @message CONTAINS Failed"
],
"remember": 10,
"enable": true
},
{
"type": "filtering",
"collapse": true,
"notice": false,
"enable": true
}
],
"nav": [
{
"type": "timepicker",
"collapse": false,
"notice": false,
"status": "Stable",
"time_options": [
"5m",
"15m",
"1h",
"6h",
"12h",
"24h",
"2d",
"7d",
"30d"
],
"refresh_intervals": [
"5s",
"10s",
"30s",
"1m",
"5m",
"15m",
"30m",
"1h",
"2h",
"1d"
],
"timefield": "@timestamp",
"now": true,
"filter_id": 0,
"enable": true
}
],
"loader": {
"save_gist": false,
"save_elasticsearch": true,
"save_local": true,
"save_default": true,
"save_temp": true,
"save_temp_ttl_enable": true,
"save_temp_ttl": "30d",
"load_gist": true,
"load_elasticsearch": true,
"load_elasticsearch_size": 20,
"load_local": true,
"hide": false
},
"refresh": "5m"
}
VMware
:
{
"title": "VMware",
"services": {
"query": {
"list": {
"0": {
"query": "*",
"alias": "",
"color": "#7EB26D",
"id": 0,
"pin": false,
"type": "lucene",
"enable": true
},
"1": {
"id": 1,
"color": "#EAB839",
"alias": "Storage Device Status",
"pin": true,
"type": "lucene",
"enable": true,
"query": "device_status: *"
},
"2": {
"id": 2,
"color": "#6ED0E0",
"alias": "VMware Warnings",
"pin": true,
"type": "lucene",
"enable": true,
"query": "vmware_warning_msg: *"
},
"4": {
"id": 4,
"color": "#E24D42",
"alias": "Latency Improved",
"pin": true,
"type": "lucene",
"enable": true,
"query": "improved"
},
"5": {
"id": 5,
"color": "#1F78C1",
"alias": "Latency Deteriorated",
"pin": true,
"type": "lucene",
"enable": true,
"query": "deteriorated"
},
"6": {
"id": 6,
"color": "#BA43A9",
"alias": "Device NAA ID",
"pin": true,
"type": "lucene",
"enable": true,
"query": "device_naa:*"
}
},
"ids": [
0,
1,
2,
4,
5,
6
]
},
"filter": {
"list": {
"0": {
"type": "time",
"field": "@timestamp",
"from": "now-12h",
"to": "now",
"mandate": "must",
"active": true,
"alias": "",
"id": 0
},
"1": {
"type": "querystring",
"query": "tags:VMware OR tags:vCenter",
"mandate": "must",
"active": true,
"alias": "",
"id": 1
}
},
"ids": [
0,
1
]
}
},
"rows": [
{
"title": "Graph",
"height": "175px",
"editable": true,
"collapse": false,
"collapsable": true,
"panels": [
{
"span": 12,
"editable": true,
"group": [
"default"
],
"type": "histogram",
"mode": "count",
"time_field": "@timestamp",
"value_field": null,
"auto_int": true,
"resolution": 100,
"interval": "5m",
"fill": 3,
"linewidth": 3,
"timezone": "browser",
"spyable": true,
"zoomlinks": true,
"bars": true,
"stack": false,
"points": false,
"lines": false,
"legend": true,
"x-axis": true,
"y-axis": true,
"percentage": false,
"interactive": true,
"queries": {
"mode": "unpinned",
"ids": [
0
]
},
"title": "Events over time",
"intervals": [
"auto",
"1s",
"1m",
"5m",
"10m",
"30m",
"1h",
"3h",
"12h",
"1d",
"1w",
"1M",
"1y"
],
"options": true,
"tooltip": {
"value_type": "cumulative",
"query_as_alias": true
},
"scale": 1,
"y_format": "none",
"grid": {
"max": null,
"min": 0
},
"annotate": {
"enable": false,
"query": "*",
"size": 20,
"field": "_type",
"sort": [
"_score",
"desc"
]
},
"pointradius": 5,
"show_query": true,
"legend_counts": true,
"zerofill": true,
"derivative": false
},
{
"error": false,
"span": 4,
"editable": true,
"type": "terms",
"loadingEditor": false,
"field": "syslog_program",
"exclude": [],
"missing": false,
"other": false,
"size": 10,
"order": "count",
"style": {
"font-size": "10pt"
},
"donut": false,
"tilt": true,
"labels": true,
"arrangement": "horizontal",
"chart": "pie",
"counter_pos": "above",
"spyable": true,
"queries": {
"mode": "unpinned",
"ids": [
0
]
},
"tmode": "terms",
"tstat": "total",
"valuefield": "",
"title": "Count of Events by appname"
},
{
"error": false,
"span": 4,
"editable": true,
"type": "terms",
"loadingEditor": false,
"field": "syslog_severity",
"exclude": [],
"missing": false,
"other": false,
"size": 10,
"order": "count",
"style": {
"font-size": "10pt"
},
"donut": false,
"tilt": true,
"labels": true,
"arrangement": "horizontal",
"chart": "bar",
"counter_pos": "above",
"spyable": true,
"queries": {
"mode": "unpinned",
"ids": [
0
]
},
"tmode": "terms",
"tstat": "total",
"valuefield": "",
"title": "Syslog Severity"
},
{
"error": false,
"span": 4,
"editable": true,
"type": "terms",
"loadingEditor": false,
"field": "@source_host",
"exclude": [
""
],
"missing": false,
"other": false,
"size": 10,
"order": "count",
"style": {
"font-size": "10pt"
},
"donut": false,
"tilt": false,
"labels": true,
"arrangement": "horizontal",
"chart": "bar",
"counter_pos": "above",
"spyable": true,
"queries": {
"mode": "unpinned",
"ids": [
0
]
},
"tmode": "terms",
"tstat": "total",
"valuefield": "",
"title": "Top Hosts"
}
],
"notice": false
},
{
"title": "Issues and Warnings",
"height": "150px",
"editable": true,
"collapse": false,
"collapsable": true,
"panels": [
{
"span": 12,
"editable": true,
"type": "histogram",
"loadingEditor": false,
"mode": "count",
"time_field": "@timestamp",
"value_field": null,
"x-axis": true,
"y-axis": true,
"scale": 1,
"y_format": "none",
"grid": {
"max": null,
"min": 0
},
"queries": {
"mode": "selected",
"ids": [
2,
5
]
},
"annotate": {
"enable": false,
"query": "*",
"size": 20,
"field": "_type",
"sort": [
"_score",
"desc"
]
},
"auto_int": true,
"resolution": 100,
"interval": "5m",
"intervals": [
"auto",
"1s",
"1m",
"5m",
"10m",
"30m",
"1h",
"3h",
"12h",
"1d",
"1w",
"1y"
],
"lines": true,
"fill": 3,
"linewidth": 3,
"points": false,
"pointradius": 5,
"bars": false,
"stack": false,
"spyable": true,
"zoomlinks": true,
"options": true,
"legend": false,
"show_query": true,
"interactive": true,
"legend_counts": true,
"timezone": "browser",
"percentage": false,
"zerofill": true,
"derivative": false,
"tooltip": {
"value_type": "cumulative",
"query_as_alias": true
},
"title": "warnings and alerts"
},
{
"error": false,
"span": 4,
"editable": true,
"type": "terms",
"loadingEditor": false,
"field": "@source_host",
"exclude": [],
"missing": false,
"other": false,
"size": 10,
"order": "count",
"style": {
"font-size": "8pt"
},
"donut": false,
"tilt": false,
"labels": true,
"arrangement": "horizontal",
"chart": "bar",
"counter_pos": "above",
"spyable": true,
"queries": {
"mode": "selected",
"ids": [
4,
5
]
},
"tmode": "terms",
"tstat": "total",
"valuefield": "",
"title": "host datastore latency alerts"
},
{
"error": false,
"span": 4,
"editable": true,
"type": "terms",
"loadingEditor": false,
"field": "device_naa",
"exclude": [],
"missing": false,
"other": false,
"size": 10,
"order": "count",
"style": {
"font-size": "8pt"
},
"donut": false,
"tilt": false,
"labels": true,
"arrangement": "horizontal",
"chart": "table",
"counter_pos": "above",
"spyable": true,
"queries": {
"mode": "selected",
"ids": [
4,
5
]
},
"tmode": "terms",
"tstat": "total",
"valuefield": "",
"title": "datastore latency alerts"
},
{
"error": false,
"span": 4,
"editable": true,
"type": "terms",
"loadingEditor": false,
"field": "device_status",
"exclude": [],
"missing": false,
"other": false,
"size": 10,
"order": "count",
"style": {
"font-size": "8pt"
},
"donut": false,
"tilt": false,
"labels": true,
"arrangement": "horizontal",
"chart": "table",
"counter_pos": "above",
"spyable": true,
"queries": {
"mode": "unpinned",
"ids": [
0
]
},
"tmode": "terms",
"tstat": "total",
"valuefield": "",
"title": "datastore(s) connectivty alerts"
},
{
"error": false,
"span": 4,
"editable": true,
"type": "terms",
"loadingEditor": false,
"field": "device_naa",
"exclude": [],
"missing": false,
"other": false,
"size": 10,
"order": "count",
"style": {
"font-size": "8pt"
},
"donut": false,
"tilt": false,
"labels": true,
"arrangement": "horizontal",
"chart": "table",
"counter_pos": "above",
"spyable": true,
"queries": {
"mode": "selected",
"ids": [
1
]
},
"tmode": "terms",
"tstat": "total",
"valuefield": "",
"title": "Datastore(s) With Connectivity Issues"
},
{
"span": 4,
"editable": true,
"type": "histogram",
"loadingEditor": false,
"mode": "mean",
"time_field": "@timestamp",
"value_field": "datastore_latency_from",
"x-axis": true,
"y-axis": true,
"scale": 1,
"y_format": "none",
"grid": {
"max": null,
"min": 0
},
"queries": {
"mode": "unpinned",
"ids": [
0
]
},
"annotate": {
"enable": false,
"query": "*",
"size": 20,
"field": "_type",
"sort": [
"_score",
"desc"
]
},
"auto_int": true,
"resolution": 100,
"interval": "5m",
"intervals": [
"auto",
"1s",
"1m",
"5m",
"10m",
"30m",
"1h",
"3h",
"12h",
"1d",
"1w",
"1y"
],
"lines": true,
"fill": 3,
"linewidth": 3,
"points": false,
"pointradius": 5,
"bars": false,
"stack": true,
"spyable": true,
"zoomlinks": true,
"options": true,
"legend": false,
"show_query": true,
"interactive": true,
"legend_counts": true,
"timezone": "browser",
"percentage": false,
"zerofill": true,
"derivative": false,
"tooltip": {
"value_type": "cumulative",
"query_as_alias": true
},
"title": "previous latency"
},
{
"span": 4,
"editable": true,
"type": "histogram",
"loadingEditor": false,
"mode": "mean",
"time_field": "@timestamp",
"value_field": "datastore_latency_to",
"x-axis": true,
"y-axis": true,
"scale": 1,
"y_format": "none",
"grid": {
"max": null,
"min": 0
},
"queries": {
"mode": "unpinned",
"ids": [
0
]
},
"annotate": {
"enable": false,
"query": "*",
"size": 20,
"field": "_type",
"sort": [
"_score",
"desc"
]
},
"auto_int": true,
"resolution": 100,
"interval": "5m",
"intervals": [
"auto",
"1s",
"1m",
"5m",
"10m",
"30m",
"1h",
"3h",
"12h",
"1d",
"1w",
"1y"
],
"lines": true,
"fill": 3,
"linewidth": 3,
"points": false,
"pointradius": 5,
"bars": false,
"stack": true,
"spyable": true,
"zoomlinks": true,
"options": true,
"legend": false,
"show_query": true,
"interactive": true,
"legend_counts": true,
"timezone": "browser",
"percentage": false,
"zerofill": true,
"derivative": false,
"tooltip": {
"value_type": "cumulative",
"query_as_alias": true
},
"title": "current latency"
}
],
"notice": false
},
{
"title": "Events",
"height": "350px",
"editable": true,
"collapse": false,
"collapsable": true,
"panels": [
{
"title": "All events",
"error": false,
"span": 12,
"editable": true,
"group": [
"default"
],
"type": "table",
"size": 100,
"pages": 5,
"offset": 0,
"sort": [
"@timestamp",
"desc"
],
"style": {
"font-size": "9pt"
},
"overflow": "min-height",
"fields": [
"@timestamp",
"@source_host",
"@message",
"syslog_program",
"syslog_severity",
"syslog_facility"
],
"localTime": true,
"timeField": "@timestamp",
"highlight": [],
"sortable": true,
"header": true,
"paging": true,
"spyable": true,
"queries": {
"mode": "unpinned",
"ids": [
0
]
},
"field_list": true,
"status": "Stable",
"trimFactor": 300,
"normTimes": true,
"all_fields": false
}
],
"notice": false
}
],
"editable": true,
"failover": false,
"index": {
"interval": "day",
"pattern": "[logstash-]YYYY.MM.DD",
"default": "NO_TIME_FILTER_OR_INDEX_PATTERN_NOT_MATCHED",
"warm_fields": true
},
"style": "dark",
"panel_hints": true,
"pulldowns": [
{
"type": "query",
"collapse": true,
"notice": false,
"query": "*",
"pinned": true,
"history": [
"device_naa:*",
"deteriorated",
"improved",
"vmware_warning_msg: *",
"device_status: *",
"*",
"\"N9Vim\"",
"\"PROXY connection to NFC\"",
"PROXY connection to NFC",
"device_access:*"
],
"remember": 10,
"enable": true
},
{
"type": "filtering",
"collapse": true,
"notice": false,
"enable": true
}
],
"nav": [
{
"type": "timepicker",
"collapse": false,
"notice": false,
"status": "Stable",
"time_options": [
"5m",
"15m",
"1h",
"6h",
"12h",
"24h",
"2d",
"7d",
"30d"
],
"refresh_intervals": [
"5s",
"10s",
"30s",
"1m",
"5m",
"15m",
"30m",
"1h",
"2h",
"1d"
],
"timefield": "@timestamp",
"now": true,
"filter_id": 0,
"enable": true
}
],
"loader": {
"save_gist": false,
"save_elasticsearch": true,
"save_local": true,
"save_default": true,
"save_temp": true,
"save_temp_ttl_enable": true,
"save_temp_ttl": "30d",
"load_gist": true,
"load_elasticsearch": true,
"load_elasticsearch_size": 20,
"load_local": true,
"hide": false
},
"refresh": "5m"
}
Windows
:
{
"title": "Windows",
"services": {
"query": {
"list": {
"0": {
"query": "*",
"alias": "",
"color": "#7EB26D",
"id": 0,
"pin": false,
"type": "lucene",
"enable": true
}
},
"ids": [
0
]
},
"filter": {
"list": {
"0": {
"type": "time",
"field": "@timestamp",
"from": "now-24h",
"to": "now",
"mandate": "must",
"active": true,
"alias": "",
"id": 0
},
"1": {
"type": "field",
"field": "type",
"query": "\"eventlog\"",
"mandate": "must",
"active": true,
"alias": "",
"id": 1
}
},
"ids": [
0,
1
]
}
},
"rows": [
{
"title": "Graph",
"height": "175px",
"editable": true,
"collapse": false,
"collapsable": true,
"panels": [
{
"span": 12,
"editable": true,
"group": [
"default"
],
"type": "histogram",
"mode": "count",
"time_field": "@timestamp",
"value_field": null,
"auto_int": true,
"resolution": 100,
"interval": "10m",
"fill": 3,
"linewidth": 3,
"timezone": "browser",
"spyable": true,
"zoomlinks": true,
"bars": true,
"stack": true,
"points": false,
"lines": false,
"legend": true,
"x-axis": true,
"y-axis": true,
"percentage": false,
"interactive": true,
"queries": {
"mode": "unpinned",
"ids": [
0
]
},
"title": "Events over time",
"intervals": [
"auto",
"1s",
"1m",
"5m",
"10m",
"30m",
"1h",
"3h",
"12h",
"1d",
"1w",
"1M",
"1y"
],
"options": true,
"tooltip": {
"value_type": "cumulative",
"query_as_alias": true
},
"scale": 1,
"y_format": "none",
"grid": {
"max": null,
"min": 0
},
"annotate": {
"enable": false,
"query": "*",
"size": 20,
"field": "_type",
"sort": [
"_score",
"desc"
]
},
"pointradius": 5,
"show_query": true,
"legend_counts": true,
"zerofill": true,
"derivative": false
},
{
"error": false,
"span": 4,
"editable": true,
"type": "terms",
"loadingEditor": false,
"field": "@source_host",
"exclude": [],
"missing": false,
"other": false,
"size": 10,
"order": "count",
"style": {
"font-size": "10pt"
},
"donut": false,
"tilt": false,
"labels": true,
"arrangement": "horizontal",
"chart": "bar",
"counter_pos": "above",
"spyable": true,
"queries": {
"mode": "unpinned",
"ids": [
0
]
},
"tmode": "terms",
"tstat": "total",
"valuefield": "",
"title": "Top Hosts"
},
{
"error": false,
"span": 4,
"editable": true,
"type": "terms",
"loadingEditor": false,
"field": "Category",
"exclude": [],
"missing": false,
"other": false,
"size": 10,
"order": "count",
"style": {
"font-size": "10pt"
},
"donut": false,
"tilt": false,
"labels": true,
"arrangement": "horizontal",
"chart": "bar",
"counter_pos": "above",
"spyable": true,
"queries": {
"mode": "unpinned",
"ids": [
0
]
},
"tmode": "terms",
"tstat": "total",
"valuefield": "",
"title": "Top Event Categories"
},
{
"error": false,
"span": 4,
"editable": true,
"type": "terms",
"loadingEditor": false,
"field": "SourceName",
"exclude": [],
"missing": false,
"other": false,
"size": 10,
"order": "count",
"style": {
"font-size": "10pt"
},
"donut": false,
"tilt": false,
"labels": true,
"arrangement": "horizontal",
"chart": "bar",
"counter_pos": "above",
"spyable": true,
"queries": {
"mode": "unpinned",
"ids": [
0
]
},
"tmode": "terms",
"tstat": "total",
"valuefield": "",
"title": "Top EventLog Sources"
},
{
"error": false,
"span": 4,
"editable": true,
"type": "terms",
"loadingEditor": false,
"field": "Severity",
"exclude": [],
"missing": false,
"other": false,
"size": 10,
"order": "count",
"style": {
"font-size": "10pt"
},
"donut": false,
"tilt": false,
"labels": true,
"arrangement": "horizontal",
"chart": "bar",
"counter_pos": "above",
"spyable": true,
"queries": {
"mode": "unpinned",
"ids": [
0
]
},
"tmode": "terms",
"tstat": "total",
"valuefield": "",
"title": "Severity Levels"
},
{
"error": false,
"span": 4,
"editable": true,
"type": "terms",
"loadingEditor": false,
"field": "AccountName",
"exclude": [],
"missing": false,
"other": false,
"size": 10,
"order": "count",
"style": {
"font-size": "10pt"
},
"donut": false,
"tilt": false,
"labels": true,
"arrangement": "horizontal",
"chart": "table",
"counter_pos": "above",
"spyable": true,
"queries": {
"mode": "unpinned",
"ids": [
0
]
},
"tmode": "terms",
"tstat": "total",
"valuefield": "",
"title": "Top Event Usernames"
},
{
"error": false,
"span": 4,
"editable": true,
"type": "terms",
"loadingEditor": false,
"field": "EventID",
"exclude": [],
"missing": false,
"other": false,
"size": 10,
"order": "count",
"style": {
"font-size": "10pt"
},
"donut": false,
"tilt": false,
"labels": true,
"arrangement": "horizontal",
"chart": "table",
"counter_pos": "above",
"spyable": true,
"queries": {
"mode": "unpinned",
"ids": [
0
]
},
"tmode": "terms",
"tstat": "total",
"valuefield": "",
"title": "Top EventIDs"
}
],
"notice": false
},
{
"title": "Events",
"height": "350px",
"editable": true,
"collapse": false,
"collapsable": true,
"panels": [
{
"title": "All events",
"error": false,
"span": 12,
"editable": true,
"group": [
"default"
],
"type": "table",
"size": 100,
"pages": 5,
"offset": 0,
"sort": [
"@timestamp",
"desc"
],
"style": {
"font-size": "9pt"
},
"overflow": "min-height",
"fields": [
"@timestamp",
"@source_host",
"@message",
"Severity",
"Category",
"SourceName",
"AccountName"
],
"localTime": true,
"timeField": "@timestamp",
"highlight": [],
"sortable": true,
"header": true,
"paging": true,
"spyable": true,
"queries": {
"mode": "unpinned",
"ids": [
0
]
},
"field_list": true,
"status": "Stable",
"trimFactor": 300,
"normTimes": true,
"all_fields": false
}
],
"notice": false
}
],
"editable": true,
"failover": false,
"index": {
"interval": "day",
"pattern": "[logstash-]YYYY.MM.DD",
"default": "NO_TIME_FILTER_OR_INDEX_PATTERN_NOT_MATCHED",
"warm_fields": true
},
"style": "dark",
"panel_hints": true,
"pulldowns": [
{
"type": "query",
"collapse": true,
"notice": false,
"query": "*",
"pinned": true,
"history": [],
"remember": 10,
"enable": true
},
{
"type": "filtering",
"collapse": true,
"notice": false,
"enable": true
}
],
"nav": [
{
"type": "timepicker",
"collapse": false,
"notice": false,
"status": "Stable",
"time_options": [
"5m",
"15m",
"1h",
"6h",
"12h",
"24h",
"2d",
"7d",
"30d"
],
"refresh_intervals": [
"5s",
"10s",
"30s",
"1m",
"5m",
"15m",
"30m",
"1h",
"2h",
"1d"
],
"timefield": "@timestamp",
"now": true,
"filter_id": 0,
"enable": true
}
],
"loader": {
"save_gist": false,
"save_elasticsearch": true,
"save_local": true,
"save_default": true,
"save_temp": true,
"save_temp_ttl_enable": true,
"save_temp_ttl": "30d",
"load_gist": true,
"load_elasticsearch": true,
"load_elasticsearch_size": 20,
"load_local": true,
"hide": false
},
"refresh": "5m"
}
To view your Elasticsearch Elastic HQ plugin
go here .
To view the Elasticsearch Paramedic plugin
go here .
To view the
Elasticsearch Head plugin
go here .
To view the Elasticsearch Marvel plugin
go here .
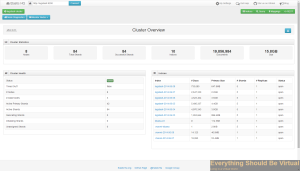
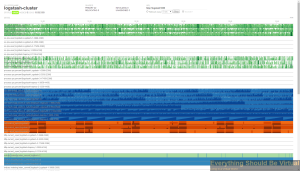
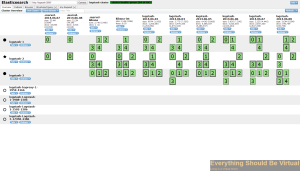
To view your HAProxy stats
go here .
(Login with admin/admin)
So there you have it. A highly available ELK setup which also allows us
to scale out extremely easy and is repeatable.
While I have been going through this setup and testing out different
components brought to light many other options for HAProxy and the ideas
behind this post so stay tuned to more soon. As well as I will be
providing a visio drawing of the layout. I am also working on some
scripts to setup a proxy (nginx) in front of kibana for ssl password
protection to login and to redirect ES queries through the proxy; as
well as some scripts to do IPTables firewall configurations to tighten
down access into the ES nodes forcing access through the nginx proxy and
HAProxy Load Balancers mitigating access directly to an ES node. This
will all be in a follow up post very soon.
Follow up posts
Setup all ELK components to work in unicast mode instead of mutlicast discovery mode.
Here is a quick screenshot of performance from the marvel plugin just
for reference. Only processing about 6GB/Day right now.
And the Visio drawing to represent the components.
Enjoy!
Need help with your ELK Stack deployments? Head over
here and
see how we can help.
NEW !!!!
If you are looking for a way of deploying this using Ansible head
over
here .