Ubuntu Logstash Server with Kibana3 Front End Autoinstall
I have been using Graylog2 and VMware Log Insight for some time now and wanted to try out Logstash finally. So the first thing that I wanted to do was create an automated script to do most of the install and configuration to get everything running. I figured that as I am going through this I would share with everyone and start building on this script more based on feedback. I created a Graylog2 script (located here) that has proven to be of great help to the community and figured I might be able to do the same with the Logstash community, but even if it didn’t I would learn a great deal about Logstash in the meantime. There is a great community around Logstash so getting support should be very easy. As well as, I am just starting to learn Logstash now so this should be a lot of fun. Which also means that there will be a good amount of change around this post.
First off I will be keeping this script updated and available on Github located here. This will be the only location that I will be keeping up with it.
I would recommend using a clean install of Ubuntu 12.04 or 14.04 to install onto. However; if you decide to install on an existing server I am not responsible for anything that may get broken. :)
So here is how we get started and get everything up and running. Open up a terminal session on your server that you will be installing to and run the following commands.
For Logstash 1.3.x version: (OUTDATED!!)
sudo apt-get update
sudo apt-get -y install git
cd ~
git clone https://github.com/mrlesmithjr/Logstash_Kibana3
chmod +x ./Logstash_Kibana3/install_logstash_kibana_ubuntu.sh
sudo ./Logstash_Kibana3/install_logstash_kibana_ubuntu.sh
```jinja2
For Logstash 1.4.x version: **(CURRENT)**
```bash
sudo apt-get update
sudo apt-get -y install git
cd ~
git clone https://github.com/mrlesmithjr/Logstash_Kibana3
chmod +x ./Logstash_Kibana3/install_logstash_1.4_kibana_ubuntu.sh
sudo ./Logstash_Kibana3/install_logstash_1.4_kibana_ubuntu.sh
```jinja2
You will be prompted during the script to enter your domain name,
~~vSphere naming convention~~ and
[PFSense](https://www.pfsense.org/ "https\://www.pfsense.org/")Firewall
hostname. These will be used to configure logstash filtering for your
~~ESXi hosts~~ and PFSense Firewall. If you do not monitor any ~~vSphere
hosts~~ or use PFSense just enter some random info into these. These are
purely just collecting info to pass into a filtering rule for Logstash.
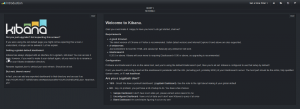
Once complete open your browser of choice and connect to
<http://logstashservername/kibana> or <http://ipaddress/kibana>.
You will see the following screen once connected. Seeing as we are
setting up Logstash with Kibana go ahead and select the link on the
left.
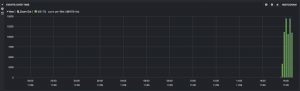
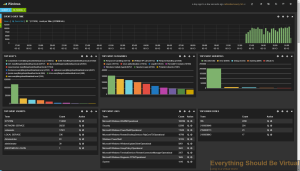
Now here is a screenshot of some actual ESXi logging. Notice the tag
called VMware, that is created by the filtering rule that we created
with the installer which, is based off of the naming convention we
passed to the installer.
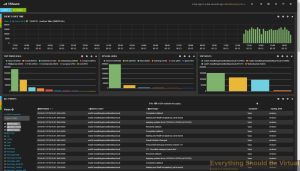
`VMware dashboard`:
<noscript><pre>{
"title": "VMware",
"services": {
"query": {
"list": {
"0": {
"query": "*",
"alias": "",
"color": "#7EB26D",
"id": 0,
"pin": false,
"type": "lucene",
"enable": true
}
},
"ids": [
0
]
},
"filter": {
"list": {
"0": {
"type": "time",
"field": "@timestamp",
"from": "now-24h",
"to": "now",
"mandate": "must",
"active": true,
"alias": "",
"id": 0
},
"1": {
"type": "querystring",
"query": "tags:VMware",
"mandate": "must",
"active": true,
"alias": "",
"id": 1
}
},
"ids": [
0,
1
]
}
},
"rows": [
{
"title": "Graph",
"height": "175px",
"editable": true,
"collapse": false,
"collapsable": true,
"panels": [
{
"span": 12,
"editable": true,
"group": [
"default"
],
"type": "histogram",
"mode": "count",
"time_field": "@timestamp",
"value_field": null,
"auto_int": true,
"resolution": 100,
"interval": "10m",
"fill": 3,
"linewidth": 3,
"timezone": "browser",
"spyable": true,
"zoomlinks": true,
"bars": true,
"stack": false,
"points": false,
"lines": false,
"legend": true,
"x-axis": true,
"y-axis": true,
"percentage": false,
"interactive": true,
"queries": {
"mode": "selected",
"ids": [
0
]
},
"title": "Events over time",
"intervals": [
"auto",
"1s",
"1m",
"5m",
"10m",
"30m",
"1h",
"3h",
"12h",
"1d",
"1w",
"1M",
"1y"
],
"options": true,
"tooltip": {
"value_type": "cumulative",
"query_as_alias": true
},
"scale": 1,
"y_format": "none",
"grid": {
"max": null,
"min": 0
},
"annotate": {
"enable": false,
"query": "*",
"size": 20,
"field": "_type",
"sort": [
"_score",
"desc"
]
},
"pointradius": 5,
"show_query": true,
"legend_counts": true,
"zerofill": true,
"derivative": false
},
{
"error": false,
"span": 4,
"editable": true,
"type": "terms",
"loadingEditor": false,
"field": "program",
"exclude": [],
"missing": false,
"other": false,
"size": 10,
"order": "count",
"style": {
"font-size": "10pt"
},
"donut": false,
"tilt": false,
"labels": true,
"arrangement": "horizontal",
"chart": "bar",
"counter_pos": "above",
"spyable": true,
"queries": {
"mode": "all",
"ids": [
0
]
},
"tmode": "terms",
"tstat": "total",
"valuefield": "",
"title": "Top Processes"
},
{
"error": false,
"span": 4,
"editable": true,
"type": "terms",
"loadingEditor": false,
"field": "syslog_level",
"exclude": [],
"missing": false,
"other": false,
"size": 10,
"order": "count",
"style": {
"font-size": "10pt"
},
"donut": false,
"tilt": false,
"labels": true,
"arrangement": "horizontal",
"chart": "bar",
"counter_pos": "above",
"spyable": true,
"queries": {
"mode": "all",
"ids": [
0
]
},
"tmode": "terms",
"tstat": "total",
"valuefield": "",
"title": "Syslog Level"
},
{
"error": false,
"span": 4,
"editable": true,
"type": "terms",
"loadingEditor": false,
"field": "@source_host",
"exclude": [
""
],
"missing": false,
"other": false,
"size": 10,
"order": "count",
"style": {
"font-size": "10pt"
},
"donut": false,
"tilt": false,
"labels": true,
"arrangement": "horizontal",
"chart": "bar",
"counter_pos": "above",
"spyable": true,
"queries": {
"mode": "all",
"ids": [
0
]
},
"tmode": "terms",
"tstat": "total",
"valuefield": "",
"title": "Top Hosts"
}
],
"notice": false
},
{
"title": "Events",
"height": "350px",
"editable": true,
"collapse": false,
"collapsable": true,
"panels": [
{
"title": "All events",
"error": false,
"span": 12,
"editable": true,
"group": [
"default"
],
"type": "table",
"size": 100,
"pages": 5,
"offset": 0,
"sort": [
"@timestamp",
"desc"
],
"style": {
"font-size": "9pt"
},
"overflow": "min-height",
"fields": [
"@timestamp",
"@source_host",
"@message",
"program",
"syslog_level"
],
"localTime": true,
"timeField": "@timestamp",
"highlight": [],
"sortable": true,
"header": true,
"paging": true,
"spyable": true,
"queries": {
"mode": "all",
"ids": [
0
]
},
"field_list": true,
"status": "Stable",
"trimFactor": 300,
"normTimes": true,
"all_fields": false
}
],
"notice": false
}
],
"editable": true,
"failover": false,
"index": {
"interval": "day",
"pattern": "[logstash-]YYYY.MM.DD",
"default": "NO_TIME_FILTER_OR_INDEX_PATTERN_NOT_MATCHED",
"warm_fields": true
},
"style": "dark",
"panel_hints": true,
"pulldowns": [
{
"type": "query",
"collapse": true,
"notice": false,
"query": "*",
"pinned": true,
"history": [
"*",
"tags:VMware",
"tag:VMware",
"type:VMware",
"host:\"esxi01.everythingshouldbevirtual.local\"",
"host:\"esxi02.everythingshouldbevirtual.local\"",
"host:\"esxi03.everythingshouldbevirtual.local\""
],
"remember": 10,
"enable": true
},
{
"type": "filtering",
"collapse": true,
"notice": false,
"enable": true
}
],
"nav": [
{
"type": "timepicker",
"collapse": false,
"notice": false,
"status": "Stable",
"time_options": [
"5m",
"15m",
"1h",
"6h",
"12h",
"24h",
"2d",
"7d",
"30d"
],
"refresh_intervals": [
"5s",
"10s",
"30s",
"1m",
"5m",
"15m",
"30m",
"1h",
"2h",
"1d"
],
"timefield": "@timestamp",
"now": true,
"filter_id": 0,
"enable": true
}
],
"loader": {
"save_gist": false,
"save_elasticsearch": true,
"save_local": true,
"save_default": true,
"save_temp": true,
"save_temp_ttl_enable": true,
"save_temp_ttl": "30d",
"load_gist": true,
"load_elasticsearch": true,
"load_elasticsearch_size": 20,
"load_local": true,
"hide": false
},
"refresh": "5m"
}</pre></noscript><script src="https://gist.github.com/mrlesmithjr/8f8ff8e2e8e6f43cb701.js"> </script>
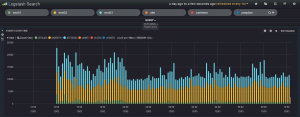
Here is another screenshot of logging graphs by adding different search
criteria items.
So what we have done with this script is installed ~~Apache2~~, Nginx,
Elasticsearch, Logstash and Kibana3. ~~Logstash has been configured to
listen on UDP/514 (PFsense, SYSLOG and VMware), TCP/514 (recommended),
UDP/514 (syslog devices that cannot be sent to TCP/514) TCP/3515
(Windows Event Logs) and TCP/3525 (Windows IIS Logging).~~
Now setup your network devices to start sending their syslogs to the
HAProxy VIP and if your device supports sending via TCP, use it.
Reference the port list below on setting up some of the devices that are
pre-configured during the setup.
**Port List**
- TCP/514 Syslog (Devices supporting TCP)
- UDP/514 Syslog (Devices that do not support TCP)
- TCP/1514 VMware ESXi
- TCP/1515 VMware vCenter (Windows install or appliance) (For Windows
install use NXLog from below in device setup) (For appliance reference
device setup below)
- TCP/3515 Windows Eventlog (Use NXLog from below in device setup)
- TCP/3525 Windows IIS Logs (Use NXLog from below in device setup)
Below is a decent /etc/logstash/logstash.conf file that I am using and
will be updating periodically. Some of these settings will be included
in the install script but not all of them. You will need to change the
naming for ESXi and PFSense for your environment. (Or just use the
auto-install script).
<noscript><pre>input {
redis {
host => "127.0.0.1"
data_type => "list"
key => "logstash"
}
}
input {
udp {
type => "syslog"
port => "514"
}
}
input {
tcp {
type => "eventlog"
port => 3515
format => 'json'
}
}
input {
tcp {
type => "iis"
port => 3525
format => 'json'
}
}
filter {
if [type] == "syslog" {
dns {
reverse => [ "host" ] action => "replace"
}
if [host] =~ /.*?(nsvpx).*?(everythingshouldbevirtual.local)?/ {
mutate {
add_tag => [ "Netscaler", "Ready" ]
}
}
if [host] =~ /.*?(pfsense).*?(everythingshouldbevirtual.local)?/ {
mutate {
add_tag => [ "PFSense", "Ready" ]
}
}
if [host] =~ /.*?(esxi).*?(everythingshouldbevirtual.local)?/ {
mutate {
add_tag => [ "VMware", "Ready" ]
}
}
if [host] =~ /.*?(vcsa).*?(everythingshouldbevirtual.local)?/ {
mutate {
add_tag => [ "vCenter", "Ready" ]
}
}
if "Ready" not in [tags] {
mutate {
add_tag => [ "syslog" ]
}
}
}
if [type] == "eventlog" {
mutate {
add_tag => [ "WindowsEventLog" ]
}
}
if [type] == "iis" {
mutate {
add_tag => [ "IISLogs" ]
}
}
}
filter {
if [type] == "syslog" {
mutate {
remove_tag => "Ready"
}
}
}
filter {
if "syslog" in [tags] {
grok {
match => { "message" => "<%{POSINT:syslog_pri}>%{SYSLOGTIMESTAMP:syslog_timestamp} %{SYSLOGHOST:syslog_hostname} %{DATA:syslog_program}(?:\[%{POSINT:syslog_pid}\])?: %{GREEDYDATA:syslog_message}" }
add_field => [ "received_at", "%{@timestamp}" ]
add_field => [ "received_from", "%{host}" ]
}
syslog_pri { }
date {
match => [ "syslog_timestamp", "MMM d HH:mm:ss", "MMM dd HH:mm:ss" ]
}
if !("_grokparsefailure" in [tags]) {
mutate {
replace => [ "@source_host", "%{syslog_hostname}" ]
replace => [ "@message", "%{syslog_message}" ]
}
}
mutate {
remove_field => [ "syslog_hostname", "syslog_message", "syslog_timestamp" ]
}
if "_grokparsefailure" in [tags] {
drop { }
}
}
}
filter {
if "VMware" in [tags] {
grok {
break_on_match => false
match => [
"message", "<%{POSINT:syslog_pri}>%{TIMESTAMP_ISO8601:@timestamp} %{SYSLOGHOST:hostname} %{SYSLOGPROG:message_program}: (?<message-body>(?<message_system_info>(?:\[%{DATA:message_thread_id} %{DATA:syslog_level} \'%{DATA:message_service}\'\ ?%{DATA:message_opID}])) \[%{DATA:message_service_info}]\ (?<message-syslog>(%{GREEDYDATA})))",
"message", "<%{POSINT:syslog_pri}>%{TIMESTAMP_ISO8601:@timestamp} %{SYSLOGHOST:hostname} %{SYSLOGPROG:message_program}: (?<message-body>(?<message_system_info>(?:\[%{DATA:message_thread_id} %{DATA:syslog_level} \'%{DATA:message_service}\'\ ?%{DATA:message_opID}])) (?<message-syslog>(%{GREEDYDATA})))",
"message", "<%{POSINT:syslog_pri}>%{TIMESTAMP_ISO8601:@timestamp} %{SYSLOGHOST:hostname} %{SYSLOGPROG:message_program}: %{GREEDYDATA:message-syslog}"
]
}
syslog_pri { }
mutate {
replace => [ "@source_host", "%{hostname}" ]
}
mutate {
replace => [ "@message", "%{message-syslog}" ]
}
if "Device naa" in [message] {
grok {
match => [
"message", "Device naa.%{WORD:device_naa} performance has %{WORD:device_status}"
]
}
}
if "connectivity issues" in [message] {
grok {
match => [
"message", "Hostd: %{GREEDYDATA} : %{DATA:device_access} to volume %{DATA:device_id} %{DATA:datastore} (following|due to)"
]
}
}
if "WARNING" in [message] {
grok {
match => [
"message", "WARNING: %{GREEDYDATA:vmware_warning_msg}"
]
}
}
}
if "_grokparsefailure" in [tags] {
if "VMware" in [tags] {
grok {
break_on_match => false
match => [
"message", "<%{POSINT:syslog_pri}>%{DATA:message_system_info}, (?<message-body>(%{SYSLOGHOST:hostname} %{SYSLOGPROG:message_program}: %{GREEDYDATA:message-syslog}))",
"message", "${GREEDYDATA:message-syslog}"
]
}
}
}
}
filter {
if "vCenter" in [tags] {
grok {
break_on_match => false
match => [
"message", "%{TIMESTAMP_ISO8601:@timestamp} (?<message-body>(?<message_system_info>(?:\[%{DATA:message_thread_id} %{DATA:syslog_level} \'%{DATA:message_service}\'\ ?%{DATA:message_opID}])) \[%{DATA:message_service_info}]\ (?<message-syslog>(%{GREEDYDATA})))",
"message", "%{TIMESTAMP_ISO8601:@timestamp} (?<message-body>(?<message_system_info>(?:\[%{DATA:message_thread_id} %{DATA:syslog_level} \'%{DATA:message_service}\'\ ?%{DATA:message_opID}])) (?<message-syslog>(%{GREEDYDATA})))",
"message", "<%{POSINT:syslog_pri}>%{TIMESTAMP_ISO8601:@timestamp} %{GREEDYDATA:message-syslog}"
]
}
if "_grokparsefailure" in [tags] {
grok {
break_on_match => false
match => [
"message", "${GREEDYDATA:message-syslog}"
]
}
}
syslog_pri { }
mutate {
replace => [ "@message", "%{message-syslog}" ]
rename => [ "host", "@source_host" ]
rename => [ "hostname", "syslog_source-hostname" ]
rename => [ "program", "message_program" ]
rename => [ "message_vce_server", "syslog_source-hostname" ]
remove_field => [ "@version", "type", "path" ]
}
}
}
filter {
if "PFSense" in [tags] {
grok {
add_tag => [ "firewall" ]
match => [ "message", "<(?<evtid>.*)>(?<datetime>(?:Jan(?:uary)?|Feb(?:ruary)?|Mar(?:ch)?|Apr(?:il)?|May|Jun(?:e)?|Jul(?:y)?|Aug(?:ust)?|Sep(?:tember)?|Oct(?:ober)?|Nov(?:ember)?|Dec(?:ember)?)\s+(?:(?:0[1-9])|(?:[12][0-9])|(?:3[01])|[1-9]) (?:2[0123]|[01]?[0-9]):(?:[0-5][0-9]):(?:[0-5][0-9])) (?<prog>.*?): (?<msg>.*)" ]
}
mutate {
gsub => ["datetime"," "," "]
}
date {
match => [ "datetime", "MMM dd HH:mm:ss" ]
}
mutate {
replace => [ "message", "%{msg}" ]
}
mutate {
remove_field => [ "msg", "datetime" ]
}
}
if [prog] =~ /^pf$/ {
mutate {
add_tag => [ "packetfilter" ]
}
multiline {
pattern => "^\s+|^\t\s+"
what => "previous"
}
mutate {
remove_field => [ "msg", "datetime" ]
remove_tag => [ "multiline" ]
}
grok {
match => [ "message", "rule (?<rule>.*)\(.*\): (?<action>pass|block) .* on (?<iface>.*): .* proto (?<proto>TCP|UDP|IGMP|ICMP) .*\n\s*(?<src_ip>(\d+\.\d+\.\d+\.\d+))\.?(?<src_port>(\d*)) [<|>] (?<dest_ip>(\d+\.\d+\.\d+\.\d+))\.?(?<dest_port>(\d*)):" ]
}
}
if [prog] =~ /^dhcpd$/ {
if [message] =~ /^DHCPACK|^DHCPREQUEST|^DHCPOFFER/ {
grok {
match => [ "message", "(?<action>.*) (on|for|to) (?<src_ip>[0-2]?[0-9]?[0-9]\.[0-2]?[0-9]?[0-9]\.[0-2]?[0-9]?[0-9]\.[0-2]?[0-9]?[0-9]) .*(?<mac_address>[0-9a-fA-F][0-9a-fA-F]:[0-9a-fA-F][0-9a-fA-F]:[0-9a-fA-F][0-9a-fA-F]:[0-9a-fA-F][0-9a-fA-F]:[0-9a-fA-F][0-9a-fA-F]:[0-9a-fA-F][0-9a-fA-F]).* via (?<iface>.*)" ]
}
}
if [message] =~ /^DHCPDISCOVER/ {
grok {
match => [ "message", "(?<action>.*) from (?<mac_address>[0-9a-fA-F][0-9a-fA-F]:[0-9a-fA-F][0-9a-fA-F]:[0-9a-fA-F][0-9a-fA-F]:[0-9a-fA-F][0-9a-fA-F]:[0-9a-fA-F][0-9a-fA-F]:[0-9a-fA-F][0-9a-fA-F]).* via (?<iface>.*)" ]
}
}
if [message] =~ /^DHCPINFORM/ {
grok {
match => [ "message", "(?<action>.*) from (?<src_ip>.*).* via (?<iface>.*)" ]
}
}
}
if "_grokparsefailure" in [tags] {
drop { }
}
}
filter {
if "PFSense" in [tags] {
mutate {
replace => [ "@source_host", "%{host}" ]
}
mutate {
replace => [ "@message", "%{message}" ]
}
}
}
filter {
if "Netscaler" in [tags] {
grok {
break_on_match => true
match => [
"message", "<%{POSINT:syslog_pri}> %{DATE_US}:%{TIME} GMT %{SYSLOGHOST:syslog_hostname} %{GREEDYDATA:netscaler_message} : %{DATA} %{INT:netscaler_spcbid} - %{DATA} %{IP:netscaler_client_ip} - %{DATA} %{INT:netscaler_client_port} - %{DATA} %{IP:netscaler_vserver_ip} - %{DATA} %{INT:netscaler_vserver_port} %{GREEDYDATA:netscaler_message} - %{DATA} %{WORD:netscaler_session_type}",
"message", "<%{POSINT:syslog_pri}> %{DATE_US}:%{TIME} GMT %{SYSLOGHOST:syslog_hostname} %{GREEDYDATA:netscaler_message}"
]
}
syslog_pri { }
mutate {
replace => [ "@source_host", "%{host}" ]
}
mutate {
replace => [ "@message", "%{netscaler_message}" ]
}
geoip {
source => "netscaler_client_ip"
target => "geoip"
add_field => [ "[geoip][coordinates]", "%{[geoip][longitude]}" ]
add_field => [ "[geoip][coordinates]", "%{[geoip][latitude]}" ]
}
mutate {
convert => [ "[geoip][coordinates]", "float" ]
}
}
}
filter {
if "apache" in [type] {
geoip {
source => "clientip"
target => "geoip"
add_field => [ "[geoip][coordinates]", "%{[geoip][longitude]}" ]
add_field => [ "[geoip][coordinates]", "%{[geoip][latitude]}" ]
}
mutate {
convert => [ "[geoip][coordinates]", "float" ]
}
mutate {
replace => [ "@source_host", "%{host}" ]
}
mutate {
replace => [ "@message", "%{message}" ]
}
mutate {
rename => [ "verb" , "method" ]
}
mutate {
add_tag => [ "apache" ]
}
grok {
match => [
"message", "%{DATA:apache_vhost} "
]
}
}
}
filter {
if [type] == "eventlog" {
grep {
match => { "EventReceivedTime" => "\d+"}
}
mutate {
lowercase => [ "EventType", "FileName", "Hostname", "Severity" ]
}
mutate {
rename => [ "Hostname", "@source_host" ]
}
date {
match => [ "EventReceivedTime", "UNIX" ]
}
mutate {
rename => [ "Message", "@message" ]
rename => [ "Severity", "eventlog_severity" ]
rename => [ "SeverityValue", "eventlog_severity_code" ]
rename => [ "Channel", "eventlog_channel" ]
rename => [ "SourceName", "eventlog_program" ]
rename => [ "SourceModuleName", "nxlog_input" ]
rename => [ "Category", "eventlog_category" ]
rename => [ "EventID", "eventlog_id" ]
rename => [ "RecordNumber", "eventlog_record_number" ]
rename => [ "ProcessID", "eventlog_pid" ]
}
mutate {
remove => [ "SourceModuleType", "EventTimeWritten", "EventTime", "EventReceivedTime", "EventType" ]
}
}
}
filter {
if [type] == "iis" {
if [message] =~ "^#" {
drop {}
}
grok {
match => [
"message", "<%{POSINT:syslog_pri}>%{SYSLOGTIMESTAMP} %{WORD:servername} %{TIMESTAMP_ISO8601} %{IP:hostip} %{WORD:method} %{URIPATH:request} (?:%{NOTSPACE:query}|-) %{NUMBER:port} (?:%{NOTSPACE:param}|-) %{IPORHOST:clientip} %{NOTSPACE:agent} %{NUMBER:response} %{NUMBER:subresponse} %{NUMBER:bytes} %{NUMBER:time-taken}",
"message", "<%{POSINT:syslog_pri}>%{SYSLOGTIMESTAMP} %{WORD:servername} %{GREEDYDATA:syslog_message}"
]
}
date {
match => ["eventtime", "YY-MM-dd HH:mm:ss"]
}
mutate {
replace => [ "@source_host", "%{servername}" ]
}
mutate {
replace => [ "@message", "%{message}" ]
}
geoip {
source => "clientip"
target => "geoip"
add_field => [ "[geoip][coordinates]", "%{[geoip][longitude]}" ]
add_field => [ "[geoip][coordinates]", "%{[geoip][latitude]}" ]
}
mutate {
convert => [ "[geoip][coordinates]", "float" ]
}
}
}
filter {
if [type] == "mysql-slowquery" {
mutate {
add_tag => [ "Mysql" ]
}
}
}
output {
elasticsearch_http {
host => "127.0.0.1"
flush_size => 1
manage_template => true
template => "/opt/logstash/lib/logstash/outputs/elasticsearch/elasticsearch-template.json"
}
}</pre></noscript><script src="https://gist.github.com/mrlesmithjr/43b4e97bf16a7423bbd2.js"> </script>
For Windows Event Log's I highly recommend using NXLog for Windows. I
am including a fuctional nxlog.conf file for you to use as well with the
above logstash.conf configuration.
<noscript><pre>## Please set the ROOT to the folder your nxlog was installed into,
## otherwise it will not start.
#define ROOT C:\Program Files\nxlog
define ROOT C:\Program Files (x86)\nxlog
define ROOT_STRING C:\Program Files (x86)\\nxlog
Moduledir %ROOT%\modules
CacheDir %ROOT%\data
Pidfile %ROOT%\data\nxlog.pid
SpoolDir %ROOT%\data
LogFile %ROOT%\data\nxlog.log
# Enable json extension
<Extension json>
Module xm_json
</Extension>
<Extension syslog>
Module xm_syslog
</Extension>
<Processor buffer1>
Module pm_buffer
MaxSize 1024
Type Mem
WarnLimit 512
</Processor>
<Processor buffer2>
Module pm_buffer
MaxSize 1024
Type Mem
WarnLimit 512
</Processor>
# Nxlog internal logs
<Input internal>
Module im_internal
Exec $EventReceivedTime = integer($EventReceivedTime) / 1000000; to_json();
</Input>
# Windows Event Log
<Input eventlog>
# Uncomment im_msvistalog for Windows Vista/2008 and later
Module im_msvistalog
# Uncomment im_mseventlog for Windows XP/2000/2003
# Module im_mseventlog
Exec $EventReceivedTime = integer($EventReceivedTime) / 1000000; to_json();
</Input>
# Select the input folder where logs will be scanned
# Create the parse rule for IIS logs. You can copy these from the header of the IIS log file.
# Uncomment Extension w3c for IIS logging
#<Extension w3c>
# Module xm_csv
# Fields $date, $time, $s-ip, $cs-method, $cs-uri-stem, $cs-uri-query, $s-port, $cs-username, $c-ip, $csUser-Agent, $cs-referrer, $sc-status, $sc-substatus, $sc-win32-status, $time-taken
# FieldTypes string, string, string, string, string, string, integer, string, string, string, string, integer, integer, integer, integer
# Delimiter ' '
#</Extension>
# Convert the IIS logs to JSON and use the original event time
# Uncomment IIS_IN section if logging for IIS logging
#<Input IIS_IN>
# Module im_file
# File "C:\\inetpub\\logs\\LogFiles\\W3SVC2\\u_ex*"
# SavePos TRUE
# Exec if $raw_event =~ /^#/ drop(); \
# else \
# { \
# w3c->parse_csv(); \
# $EventTime = parsedate($date + " " + $time); \
# $SourceName = "IIS"; \
# $Message = to_json(); \
# }
#</Input>
# Uncomment vCenter_vpxd section for Windows vCenter logging
#<Input vCenter_vpxd>
# Module im_file
# File "C:\ProgramData\VMware\VMware VirtualCenter\Logs\vpxd-*.log"
# Exec $Message = $raw_event;
# SavePos TRUE
# Recursive TRUE
#</Input>
# Uncomment vCenter_vpxd_alert section for Windows vCenter logging
#<Input vCenter_vpxd_alert>
# Module im_file
# File "C:\ProgramData\VMware\VMware VirtualCenter\Logs\vpxd-alert-*.log"
# Exec $Message = $raw_event;
# SavePos TRUE
# Recursive TRUE
#</Input>
<Processor t>
Module pm_transformer
OutputFormat syslog_rfc3164
</Processor>
# Change Host below to match your naming
<Output out>
Module om_tcp
Host logstash
Port 3515
</Output>
# Change Host below to match your naming
# Uncomment IIS_Out section if using IIS logging
#<Output IIS_Out>
# Module om_tcp
# Host logstash
# Port 3525
#</Output>
# Change Host below to match your naming
# Uncomment vCenter_out section for vCenter logging
#<Output vCenter_out>
# Module om_tcp
# Host logstash
# Port 1515
#</Output>
# Output routing
<Route 1>
Path internal, eventlog => buffer1 => out
</Route>
# Uncomment Route 2 if using IIS logging
#<Route 2>
# Path IIS_In => IIS_Out
#</Route>
# Uncomment Route 3 for vCenter logging
#<Route 3>
# Path vCenter_vpxd, vCenter_vpxd_alert => t => vCenter_out
#</Route></pre></noscript><script src="https://gist.github.com/mrlesmithjr/cf212836b9ce162373ed.js"> </script>
Here is a screenshot of the Windows Logging if you want use the
dashboard view for Windows
<noscript><pre>{
"title": "Windows",
"services": {
"query": {
"list": {
"0": {
"query": "*",
"alias": "",
"color": "#7EB26D",
"id": 0,
"pin": false,
"type": "lucene",
"enable": true
}
},
"ids": [
0
]
},
"filter": {
"list": {
"0": {
"type": "time",
"field": "@timestamp",
"from": "now-24h",
"to": "now",
"mandate": "must",
"active": true,
"alias": "",
"id": 0
},
"1": {
"type": "field",
"field": "type",
"query": "\"eventlog\"",
"mandate": "must",
"active": true,
"alias": "",
"id": 1
}
},
"ids": [
0,
1
]
}
},
"rows": [
{
"title": "Graph",
"height": "175px",
"editable": true,
"collapse": false,
"collapsable": true,
"panels": [
{
"span": 12,
"editable": true,
"group": [
"default"
],
"type": "histogram",
"mode": "count",
"time_field": "@timestamp",
"value_field": null,
"auto_int": true,
"resolution": 100,
"interval": "10m",
"fill": 3,
"linewidth": 3,
"timezone": "browser",
"spyable": true,
"zoomlinks": true,
"bars": true,
"stack": true,
"points": false,
"lines": false,
"legend": true,
"x-axis": true,
"y-axis": true,
"percentage": false,
"interactive": true,
"queries": {
"mode": "all",
"ids": [
0
]
},
"title": "Events over time",
"intervals": [
"auto",
"1s",
"1m",
"5m",
"10m",
"30m",
"1h",
"3h",
"12h",
"1d",
"1w",
"1M",
"1y"
],
"options": true,
"tooltip": {
"value_type": "cumulative",
"query_as_alias": true
},
"scale": 1,
"y_format": "none",
"grid": {
"max": null,
"min": 0
},
"annotate": {
"enable": false,
"query": "*",
"size": 20,
"field": "_type",
"sort": [
"_score",
"desc"
]
},
"pointradius": 5,
"show_query": true,
"legend_counts": true,
"zerofill": true,
"derivative": false
},
{
"error": false,
"span": 4,
"editable": true,
"type": "terms",
"loadingEditor": false,
"field": "@source_host",
"exclude": [],
"missing": false,
"other": false,
"size": 10,
"order": "count",
"style": {
"font-size": "10pt"
},
"donut": false,
"tilt": false,
"labels": true,
"arrangement": "horizontal",
"chart": "bar",
"counter_pos": "above",
"spyable": true,
"queries": {
"mode": "all",
"ids": [
0
]
},
"tmode": "terms",
"tstat": "total",
"valuefield": "",
"title": "Top Host's"
},
{
"error": false,
"span": 4,
"editable": true,
"type": "terms",
"loadingEditor": false,
"field": "eventlog_category",
"exclude": [],
"missing": false,
"other": false,
"size": 10,
"order": "count",
"style": {
"font-size": "10pt"
},
"donut": false,
"tilt": false,
"labels": true,
"arrangement": "horizontal",
"chart": "bar",
"counter_pos": "above",
"spyable": true,
"queries": {
"mode": "all",
"ids": [
0
]
},
"tmode": "terms",
"tstat": "total",
"valuefield": "",
"title": "Top Event Categories"
},
{
"error": false,
"span": 4,
"editable": true,
"type": "terms",
"loadingEditor": false,
"field": "eventlog_severity",
"exclude": [],
"missing": false,
"other": false,
"size": 10,
"order": "count",
"style": {
"font-size": "10pt"
},
"donut": false,
"tilt": false,
"labels": true,
"arrangement": "horizontal",
"chart": "bar",
"counter_pos": "above",
"spyable": true,
"queries": {
"mode": "all",
"ids": [
0
]
},
"tmode": "terms",
"tstat": "total",
"valuefield": "",
"title": "Top Event Severities"
},
{
"error": false,
"span": 4,
"editable": true,
"type": "terms",
"loadingEditor": false,
"field": "UserID",
"exclude": [],
"missing": false,
"other": false,
"size": 10,
"order": "count",
"style": {
"font-size": "10pt"
},
"donut": false,
"tilt": false,
"labels": true,
"arrangement": "horizontal",
"chart": "table",
"counter_pos": "above",
"spyable": true,
"queries": {
"mode": "all",
"ids": [
0
]
},
"tmode": "terms",
"tstat": "total",
"valuefield": "",
"title": "Top Event UserID's"
},
{
"error": false,
"span": 4,
"editable": true,
"type": "terms",
"loadingEditor": false,
"field": "eventlog_channel",
"exclude": [],
"missing": false,
"other": false,
"size": 10,
"order": "count",
"style": {
"font-size": "10pt"
},
"donut": false,
"tilt": false,
"labels": true,
"arrangement": "horizontal",
"chart": "table",
"counter_pos": "above",
"spyable": true,
"queries": {
"mode": "all",
"ids": [
0
]
},
"tmode": "terms",
"tstat": "total",
"valuefield": "",
"title": "Top Event Logs"
},
{
"error": false,
"span": 4,
"editable": true,
"type": "terms",
"loadingEditor": false,
"field": "errorCode",
"exclude": [],
"missing": false,
"other": false,
"size": 10,
"order": "count",
"style": {
"font-size": "10pt"
},
"donut": false,
"tilt": false,
"labels": true,
"arrangement": "horizontal",
"chart": "table",
"counter_pos": "above",
"spyable": true,
"queries": {
"mode": "all",
"ids": [
0
]
},
"tmode": "terms",
"tstat": "total",
"valuefield": "",
"title": "Top Error Codes"
}
],
"notice": false
},
{
"title": "Events",
"height": "350px",
"editable": true,
"collapse": false,
"collapsable": true,
"panels": [
{
"title": "All events",
"error": false,
"span": 12,
"editable": true,
"group": [
"default"
],
"type": "table",
"size": 100,
"pages": 5,
"offset": 0,
"sort": [
"@timestamp",
"desc"
],
"style": {
"font-size": "9pt"
},
"overflow": "min-height",
"fields": [
"@timestamp",
"@source_host",
"@message",
"eventlog_category",
"eventlog_program",
"eventlog_severity",
"UserID",
"tags"
],
"localTime": true,
"timeField": "@timestamp",
"highlight": [],
"sortable": true,
"header": true,
"paging": true,
"spyable": true,
"queries": {
"mode": "all",
"ids": [
0
]
},
"field_list": true,
"status": "Stable",
"trimFactor": 300,
"normTimes": true,
"all_fields": false
}
],
"notice": false
}
],
"editable": true,
"failover": false,
"index": {
"interval": "day",
"pattern": "[logstash-]YYYY.MM.DD",
"default": "NO_TIME_FILTER_OR_INDEX_PATTERN_NOT_MATCHED",
"warm_fields": true
},
"style": "dark",
"panel_hints": true,
"pulldowns": [
{
"type": "query",
"collapse": true,
"notice": false,
"query": "*",
"pinned": true,
"history": [],
"remember": 10,
"enable": true
},
{
"type": "filtering",
"collapse": true,
"notice": false,
"enable": true
}
],
"nav": [
{
"type": "timepicker",
"collapse": false,
"notice": false,
"status": "Stable",
"time_options": [
"5m",
"15m",
"1h",
"6h",
"12h",
"24h",
"2d",
"7d",
"30d"
],
"refresh_intervals": [
"5s",
"10s",
"30s",
"1m",
"5m",
"15m",
"30m",
"1h",
"2h",
"1d"
],
"timefield": "@timestamp",
"now": true,
"filter_id": 0,
"enable": true
}
],
"loader": {
"save_gist": false,
"save_elasticsearch": true,
"save_local": true,
"save_default": true,
"save_temp": true,
"save_temp_ttl_enable": true,
"save_temp_ttl": "30d",
"load_gist": true,
"load_elasticsearch": true,
"load_elasticsearch_size": 20,
"load_local": true,
"hide": false
},
"refresh": "5m"
}</pre></noscript><script src="https://gist.github.com/mrlesmithjr/42db96d077f4d1035186.js"> </script>
** (OLD)**
~~If you want to purge and expire old logs have a look
[here](https://github.com/logstash/expire-logs "https\://github.com/logstash/expire-logs").
Jordan Sissel (creator of Logstash) has provided a python script to do
this.~~
~~Here is how you setup the script. Open a terminal on your Logstash
server and execute the following.~~
```bash
cd ~
sudo apt-get install python-pip
sudo apt-get install git
git clone https://github.com/logstash/expire-logs
cd expire-logs
sudo pip install -r requirements.txt
```bash
~~Now that you have this setup read the examples on the github link on
different scenarios.~~
~~After you purge your logs using the above method you will need to
restart elasticsearch.~~
```bash
sudo service elasticsearch restart
That should be it.
Enjoy!
All comments and feedback are very much welcomed and encouraged.
Interested in a highly available setup? Go here and checkout the Highly Available ELK (Elasticsearch, Logstash and Kibana) setup.
Comments