PowerCLI - VM and Host Metrics To Elasticsearch
While working on a project I came across a need/desire to capture vSphere metrics for VMs and Hosts and ship them to an Elasticsearch cluster. I wanted to do this in order to gain visibility into these metrics all within Kibana rather than using Grafana. Once I finally put it all together the next question which is still up in the air is how often to capture these metrics. We can use a cron job which might execute every 5 minutes or so but we need to ensure the jobs do not stack up without the previous job completing. So this decision is not set in stone but for my initial testing I am doing this every 5 minutes.
With all of this being said below is the code which will capture the metrics and then ship them off to Elasticsearch.
# Check to make sure if PowerCLI module is installed
if ((Get-InstalledModule -Name VMware.PowerCLI -ErrorAction SilentlyContinue) -eq $null) {
  Install-Module -Name VMware.PowerCLI -Scope CurrentUser | Out-Null
}

# Disable invalid cert checking
Set-PowerCLIConfiguration -InvalidCertificateAction Ignore -confirm:$false | Out-Null

# Disable participation in CEIP
Set-PowerCLIConfiguration -Scope User -ParticipateInCEIP $false -confirm:$false | Out-Null

# Define vCenter info
$vCenterServerHost = "10.0.102.60"
$vCenterUsername = "[email protected]"
$vCenterPassword = "VMw@re1!"

# Define Elasticsearch details
$indexDate = [DateTime]::UtcNow.ToString("yyyy.MM.dd")
$ES = "http://10.0.102.102:9200"

# Define separate indexes for VMs and Hosts
# This will ensure that metric types do not cause issues when the mappings are
# different.
$ES_VM_Index = "vsphere_vm_metrics"
$ES_HOST_Index = "vsphere_host_metrics"

## Connect to vCenter
Connect-VIServer $vCenterServerHost -User $vCenterUsername -Password $vCenterPassword | Out-Null

$VMs = Get-VM | Where-Object {$_.PowerState -eq "PoweredOn"}

foreach ($vm in $VMs) {
  $stats = Get-Stat -Entity $vm -Realtime -MaxSamples 1
  $stats | Add-Member -Name "Name" -Value $vm.name -MemberType NoteProperty
  $stats | Add-Member -Name "@timestamp" -Value ([DateTime]::Now.ToUniversalTime().ToString("o")) -MemberType NoteProperty
  $stats | %{Invoke-RestMethod "$ES/$ES_VM_Index-$indexDate/message" -Method POST -Body (convertto-json $_ -Depth 1)}
}

$VMHosts = Get-VMHost | Where-Object {$_.ConnectionState -eq "Connected"}

foreach ($vmhost in $VMHosts) {
  $stats = Get-Stat -Entity $vmhost -Realtime -MaxSamples 1
  $stats | Add-Member -Name "Name" -Value $vmhost.Name -MemberType NoteProperty
  $stats | Add-Member -Name "@timestamp" -Value ([DateTime]::Now.ToUniversalTime().ToString("o")) -MemberType NoteProperty
  $stats | %{Invoke-RestMethod "$ES/$ES_HOST_Index-$indexDate/message" -Method POST -Body (convertto-json $_ -Depth 1)}
}

# Disconnect from vCenter
Disconnect-VIServer * -Confirm:$false
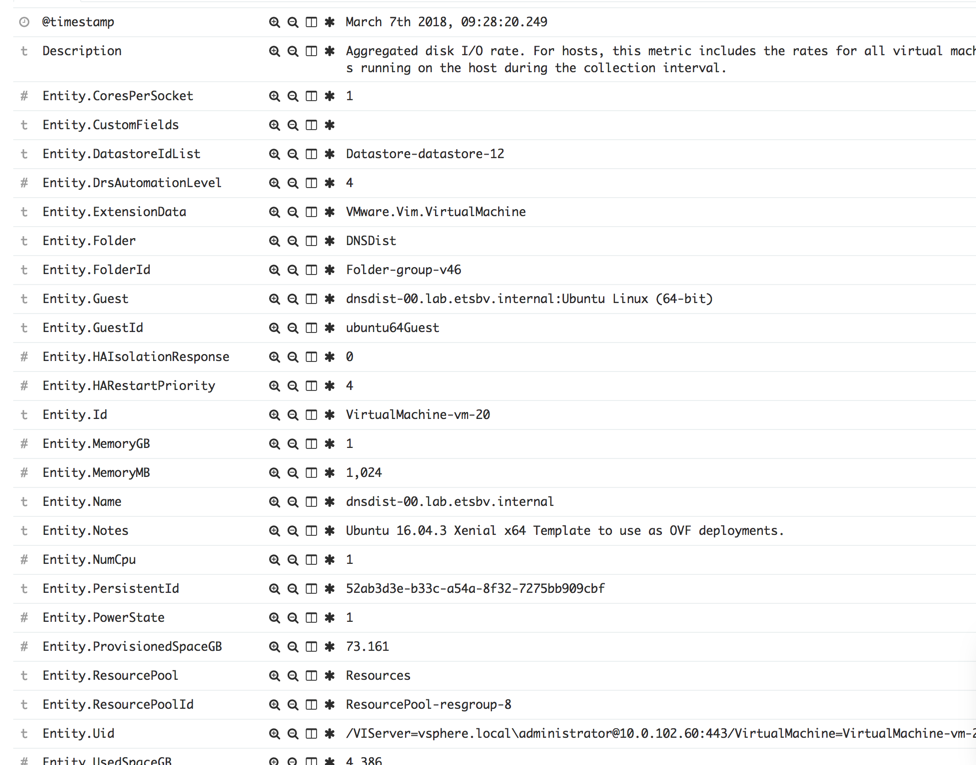
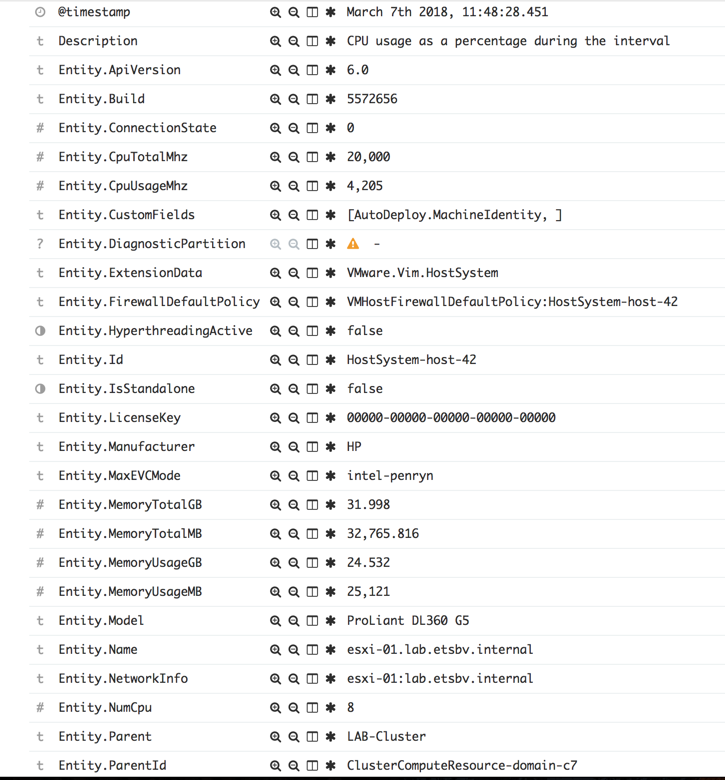
So there you have it, we can now view the metrics using Kibana:
VM Metrics:
Host Metrics:
Enjoy!
Comments